
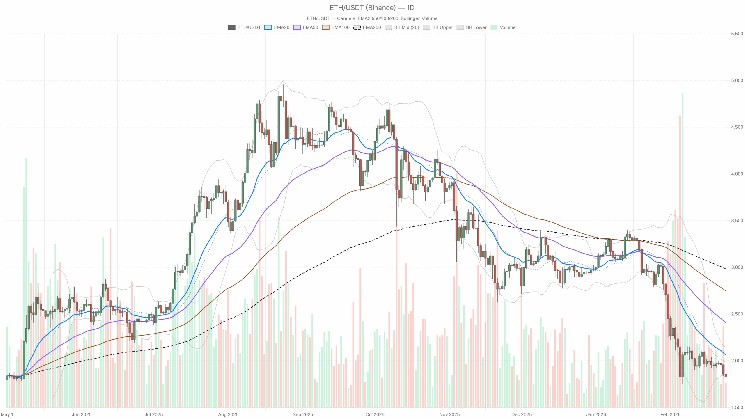

After a sharp risk-off move across digital assets, Ethereum price today is hovering near the lower end of its recent trading range as traders reassess short-term risks.
$ETH/USDT — daily chart with candlesticks, EMA20/EMA50 and volume.
Daily Chart (D1): Macro Bias – Bearish, But Oversold
Price vs EMAs (Trend Structure)
– Price (close): $1,833.01
– EMA 20: $2,060.12
– EMA 50: $2,404.48
– EMA 200: $2,983.16
– Regime: Bearish
$ETH is trading well below its 20, 50, and 200-day EMAs. That is a fully stacked bearish alignment: short-, medium-, and long-term trend all point down, with price sitting almost 200+ points under the 20-day EMA. This is a classic downtrend, not just a shallow correction. At the same time, the distance between spot and the EMAs is getting stretched, which often precedes a snapback rally even inside a larger downtrend.
RSI (Momentum / Exhaustion)
– RSI 14 (D1): 29.44
Daily RSI is under 30, firmly in oversold territory. That shows momentum has been one-sided to the downside, but it also means a lot of the immediate selling pressure has already been spent. In practice, this is where strong trend followers start thinking about taking profits on shorts, while mean-reversion traders begin hunting for a bounce. However, oversold readings can persist if macro fear remains elevated.
MACD (Trend Momentum)
– MACD line: -176.99
– Signal line: -197.89
– Histogram: +20.90
MACD is still deeply negative, confirming the broader downtrend, but the histogram has turned positive. That means the downside momentum is slowing; the selling is losing some steam compared to prior days. This is often a precursor to a relief rally, not necessarily a full trend reversal. Bears are still in control, but they are no longer accelerating.
Bollinger Bands (Volatility & Positioning)
– BB mid (20-day basis): $1,983.50
– Upper band: $2,144.44
– Lower band: $1,822.56
– Price vs bands: Close at $1,833 is sitting just above the lower band.
$ETH is hugging the lower Bollinger Band, which shows price has been pressing the downside volatility envelope. When price rides the lower band, it is a sign of persistent selling, but being this close to the band also means any relief bid can spark a quick mean-reversion move back toward the mid-line around $1,980. In other words, the tape is weak, but the risk of a short-term snapback is rising.
ATR (Daily Volatility)
– ATR 14 (D1): $93.07
Daily ATR near $93 says Ethereum is swinging roughly 5% intraday on average. That is elevated but not extreme by $ETH standards; it is consistent with a trend move rather than a blow-off panic. Risk sizing has to respect that a normal day can easily span a $100 range.
Daily Pivots (Short-Term Reference Levels)
– Pivot (PP): $1,838.13
– Resistance 1 (R1): $1,864.46
– Support 1 (S1): $1,806.69
Spot is trading just under the daily pivot, essentially straddling that $1,830–1,840 reference zone. That pivot area is the intraday battleground: trading sustainably above it would hint at a mild bounce attempt, while losing S1 around $1,807 opens the door for another leg lower within the broader downtrend.
1-Hour Chart (H1): Short-Term Flow – Bearish, But Stabilizing
Price vs EMAs
– Price (close): $1,833
– EMA 20: $1,853.79
– EMA 50: $1,888.96
– EMA 200: $1,943.73
– Regime: Bearish
On the hourly chart, $ETH is also trading below all key EMAs, confirming that the intraday trend is still down. However, price is not dramatically extended from the 20 EMA anymore; the market has stopped waterfalling and moved into more of a grind. That kind of compression can be the staging ground for either a short-covering pop back toward $1,880–1,900 or a fresh breakdown if sellers reassert control.
RSI (Intraday Momentum)
– RSI 14 (H1): 34.89
RSI on the 1H is below 40 but not oversold. That shows a bearish bias with some stabilization; the selling is no longer outright capitulation, but buyers have not stepped in with conviction either. It is a weak tape, not a complete freefall.
MACD (Intraday Trend)
– MACD line: -21.33
– Signal line: -20.46
– Histogram: -0.87
Hourly MACD sits slightly negative with a small negative histogram. The downtrend is intact, but there is no strong momentum push either way. This lines up with a consolidation after the prior drop, where the market is catching its breath rather than launching a new, decisive move.
Bollinger Bands (H1)
– BB mid: $1,857.48
– Upper band: $1,911.79
– Lower band: $1,803.16
– Price vs bands: $1,833 is sitting in the lower half of the band range.
$ETH is trading closer to the lower band but inside the envelope on the hourly chart. That is consistent with a cooling-down period after a strong selloff: volatility is still skewed to the downside, but price is not being forced out of the band anymore. It is a watch-and-wait zone.
ATR (H1 Volatility)
– ATR 14 (H1): $19.49
An hourly ATR around $19 means typical 1H candles are about $20 high-to-low. For active traders, that is a meaningful noise band. Moreover, tight stops inside that range are likely to get shaken out, especially in a choppy consolidation like this.
Hourly Pivots
– Pivot (PP): $1,829.23
– Resistance 1 (R1): $1,839.95
– Support 1 (S1): $1,822.29
Price hovers just above the hourly pivot. Holding above $1,829 and reclaiming $1,840 (R1) would point to a modest intraday recovery attempt, while slipping back under $1,829 and especially under $1,822 shifts the focus back to S1/S2 zones and a potential retest of the daily lower Bollinger Band and below.
15-Minute Chart (M15): Execution Context – Neutral, Micro Mean Reversion
Price vs EMAs
– Price (close): $1,833
– EMA 20: $1,830.14
– EMA 50: $1,842.70
– EMA 200: $1,890.15
– Regime: Neutral
On the 15-minute chart, price has reclaimed the 20 EMA but remains below the 50 and 200 EMAs. That is a short-term stabilization inside a larger downtrend: micro timeframes are trying to mean-revert, but the broader intraday and daily structures are still against the bulls.
RSI (Very Short-Term)
– RSI 14 (M15): 50.18
RSI on M15 is essentially neutral around 50. Short-term momentum has reset after the earlier selloff; neither buyers nor sellers are dictating the last few candles. This is typical of a market pausing to decide its next leg.
MACD (M15)
– MACD line: -4.11
– Signal line: -5.93
– Histogram: +1.82
The MACD on the 15-minute chart is starting to curl higher with a small positive histogram, hinting at a short-term bullish bias. That aligns with a minor relief bounce within the downtrend, not a full reversal signal.
Bollinger Bands (M15)
– BB mid: $1,827.15
– Upper band: $1,837.11
– Lower band: $1,817.19
– Price vs bands: $1,833 is in the upper half of the intraday band range.
Price has lifted from the lower part of the 15-minute band to the upper half, which fits a small intraday bounce. Volatility here is contained; the market is not seeing band expansions or blowouts, just a controlled micro mean reversion after a heavy session.
ATR (M15)
– ATR 14 (M15): $9.71
On a 15-minute basis, a $10 ATR means micro swings are big enough to matter for scalpers but small relative to the daily picture. It is tradable noise inside a higher timeframe downtrend.
15-Minute Pivots
– Pivot (PP): $1,832.78
– Resistance 1 (R1): $1,836.40
– Support 1 (S1): $1,829.37
Price is hugging the 15-minute pivot, with very tight micro levels. A push through $1,836–1,840 would line up with the 1H R1 cluster and potentially fuel a short squeeze toward $1,860–1,880. A break back under $1,829, on the other hand, would signal that the micro bounce has failed and bears are reasserting themselves quickly.
Cross-Market & Sentiment Context
The wider crypto market is in a risk-off stance:
- Total crypto market cap: ~$2.27T, down about 2.7% over 24h.
- Bitcoin dominance near 55.9%: capital favoring $BTC over alts, which usually pressures $ETH on a relative basis.
- Fear & Greed Index at 8 – Extreme Fear: sentiment is washed-out and highly emotional.
This combination is a double-edged sword for Ethereum. On one hand, extreme fear and oversold technicals often accompany important tradable lows. On the other, when the market is this nervous, forced liquidations and headline risk can easily push prices below technical support before any sustained bottom forms.
Scenarios for Ethereum Price Today
Bullish Scenario
The bullish case is a mean-reversion bounce inside a broader downtrend, not a full-blown trend reversal.
Key ingredients:
- Daily oversold + MACD easing: RSI near 29 and a softening MACD argue the immediate selling leg is tired.
- Price defends the lower Bollinger Band: Holding above roughly $1,820 keeps this in oversold but holding territory rather than a breakdown.
- Lower timeframes follow through: The 15m and 1H charts already show early signs of stabilization. If $ETH can reclaim and hold above the 1H pivot and R1 at $1,829–1,840 and the 1H EMA 20 around $1,854, then a push toward the 1H EMA 50 near $1,889 comes into play.
In that scenario, a short squeeze or relief move into the $1,880–$1,950 area is reasonable. That still leaves $ETH well below its daily EMA 20 and deep inside a longer-term downtrend, but it relieves some of the current pressure.
What invalidates the bullish scenario?
A clean daily close below the lower Bollinger Band and below $1,800, especially if accompanied by renewed expansion in ATR and a drop in the 1H RSI back toward oversold. That would say the oversold condition is being resolved via trend continuation lower, not mean reversion.
Bearish Scenario
The bearish case is a continuation of the prevailing downtrend as risk-off sentiment intensifies.
Key ingredients:
- Trend alignment is still negative: Daily, 1H, and 15m all sit below their 50 and 200 EMAs, pointing to structurally weak conditions.
- Bitcoin dominance rising / market cap falling: If $BTC continues to outperform on down days and total crypto cap keeps sliding, $ETH is likely to remain an underperformer.
- Support break: A loss of intraday supports at 15m S1 and 1H S1 around $1,822–1,829, and then daily S1 near $1,806, turns the current consolidation into a staging area for another leg down.
Under that path, $ETH can trade decisively below the lower Bollinger Band, pushing toward new local lows. With ATR at about $93, a breakdown from here easily justifies a drive into the $1,730–$1,750 zone in a single strong session if selling accelerates.
What invalidates the bearish scenario?
Bears lose their edge if $ETH can reclaim and hold above the daily pivot (~$1,838) and then the 1H and daily EMA 20 cluster in the $1,850–$2,060 region. A sustained close back above the daily EMA 20, in particular, would say the downtrend is losing structural control, forcing a reassessment of the medium-term bearish bias.
Positioning, Risk, and Uncertainty
From a professional trading standpoint, Ethereum price today sits at an uncomfortable intersection: the trend is clearly bearish, but the market is oversold and sentiment is extremely fearful. That mix often punishes both late shorts and early bottom-fishers.
For directional traders, the key decisions revolve around:
- Timeframe alignment: Daily and hourly trends argue for caution on aggressive longs; 15-minute signals are only good for timing entries within that larger bias, not fighting it outright.
- Volatility-aware sizing: With about $90 daily ATR and around $20 hourly ATR, position sizes and stop distances have to be scaled accordingly. Moves that look small on the chart can translate into significant P&L swings.
- Scenario triggers: Watch how price behaves around the $1,820–$1,840 band. Holds and reclaiming local EMAs tilt the day toward a relief bounce; failure and a clean break of $1,800 shift focus to downside extensions.
There is no clear-cut, low-risk trend entry here. This is a late-stage down move where probabilities are split between one more flush lower and a sharp countertrend bounce. In this kind of environment, patience, tight scenario definitions, and respect for volatility matter more than calling the exact bottom or top.
