
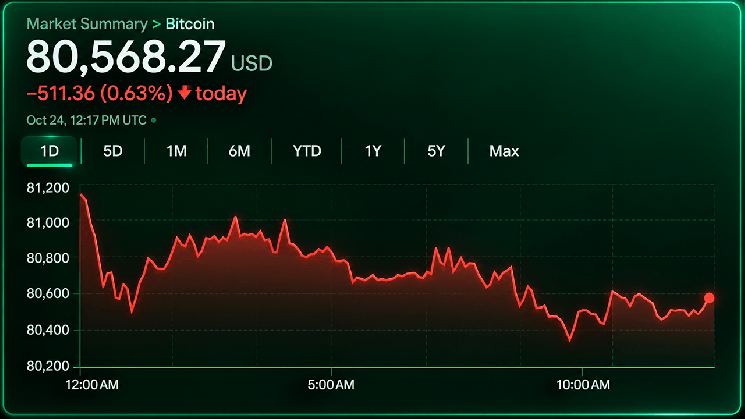

Declining volume during the last hour lows suggests selling intensity might be moderating, but buyers still face an uphill climb. A recovery through $80,800 would bring $81,200 into focus, while another failure around $80,350 would place the psychological $80,000 threshold directly in the firing line.
Four-Hour Structure Keeps Sellers in the Driver’s Seat
The four-hour chart presents a less forgiving picture, with bitcoin retreating from approximately $84,843 toward $80,499 while establishing successive lower highs and lower lows. This sequence indicates that sellers have repeatedly interrupted recovery attempts, preventing buyers from rebuilding meaningful upside momentum.
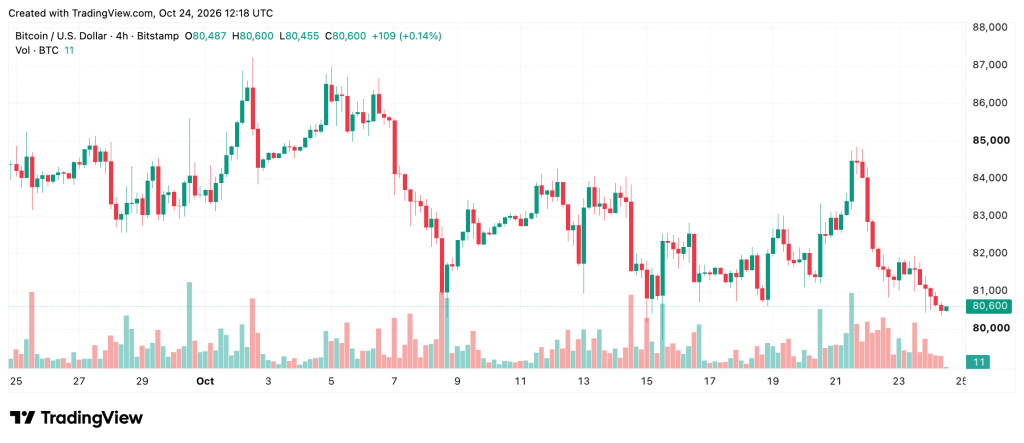
The $81,500 to $82,000 region represents the first substantial resistance barrier, and a sustained recovery beyond $82,000 would begin challenging the prevailing bearish structure. Conversely, another rejection within that range would preserve the existing downward pattern and leave the $80,350 support reference exposed to renewed pressure.
Daily Chart Reveals a Divided Technical Picture
Zooming out to the daily chart reveals that bitcoin’s price is still contending with the consequences of its earlier rejection near $87,374, a level that now sits well above the immediate trading battlefield. Lower highs and increasingly fragile recoveries have left the $82,000 to $84,000 region crowded with potential resistance, while the $80,000 psychological threshold represents the next major defensive position.
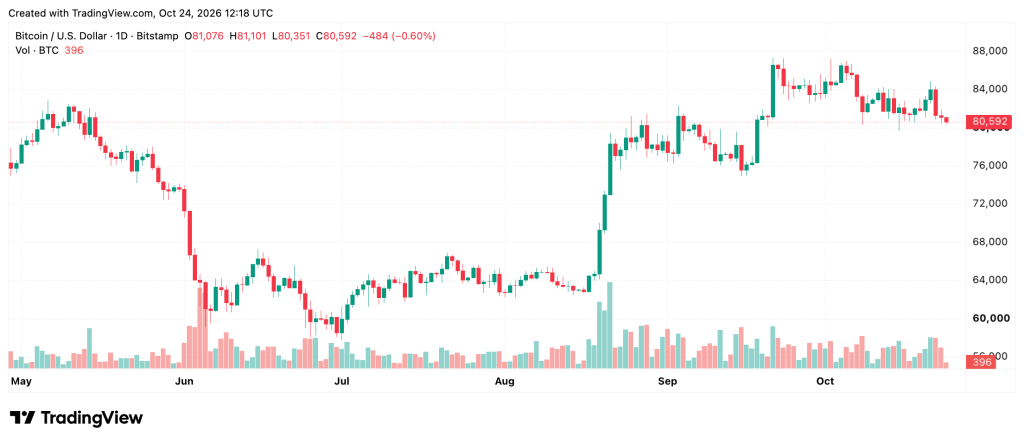
Bitcoin’s broader $81,939 session high provides another reference for measuring any recovery attempt. A daily close beneath $80,000 would strengthen the case for a move toward $79,000 and potentially $78,000, although the longer-term moving averages have not yet abandoned their positive positioning.
Oscillators Remain Neutral as Moving Averages Turn Negative
The daily chart’s oscillator readings offer a curious counterweight to bitcoin’s deteriorating price structure. The relative strength index (RSI) registered 43, suggesting negative momentum without an extreme oversold reading, while the Stochastic oscillator stood at 25 and the commodity channel index (CCI) reached minus 129. The average directional index (ADX) measured just 17, pointing to limited trend strength despite the bearish chart structure.
Meanwhile, moving average convergence divergence (MACD) registered minus 203 with a bearish signal, while the momentum indicator at minus 1,074 carried a positive classification. With nine neutral readings against one positive and one negative, the oscillators hardly suggest that sellers have achieved unanimous technical confirmation.
Moving averages (MAs) from the 24-hour view also tell a decidedly different story, with bitcoin trading below its 10-period exponential moving average (EMA) at $81,860 and 20-period simple moving average (SMA) at $82,528. The 50-period exponential moving average (EMA) at $80,782 also remains overhead, reinforcing immediate resistance. Yet the 100-period exponential moving average (EMA) at $77,526 and 200-period simple moving average (SMA) at $72,899 remain beneath spot prices, preserving a longer-term positive foundation.
