


Breaker Retest Puts the $2,300 Equilibrium in Focus
The weekly chart shows Ethereum rebounding from the lower external range liquidity at $1,505.68 before clearing the green breaker zone. Price then remained above the reclaimed area, making a retest the next important structural event.
The marked Unicorn setup adds confluence around the same region. Under the framework shown, the setup combines a breaker block with an overlapping fair value gap. That overlap matters, as the breaker should not be treated as one precise price.
Instead, the $2,300 equilibrium serves as a midpoint reference inside the broader support area. A return toward that level would test whether the previous resistance zone can continue functioning as support. The bullish structure remains intact while $ETH’s price holds above the broader breaker.
The blue projection first points toward approximately $2,800. From there, the chart shows a possible retracement into the breaker before another attempt to move higher. Sustained acceptance beneath the wider zone would weaken the reclaimed structure and reduce the relevance of the upper liquidity target.
ETF Demand Improves as Futures Leverage Declines
The technical setup is developing alongside stronger U.S. spot Ether ETF demand. The funds recorded $689.9 million in weekly inflows through September 25. BlackRock’s ETHA accounted for $326.2 million, while Fidelity’s FETH added $174 million.
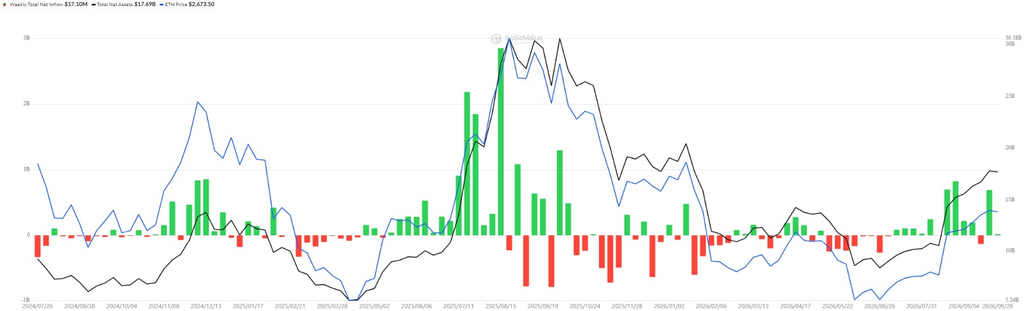
Those figures reversed roughly $140 million in outflows from the previous week. Meanwhile, derivatives positioning became less aggressive. Ethereum futures open interest fell by about 500,000 $ETH over four days, reaching 12.71 million $ETH by September 25. The estimated leverage ratio also declined to its lowest level since March.
However, lower leverage does not confirm higher prices, but it shows reduced leveraged exposure in futures. Consequently, these conditions do not replace the chart’s technical requirements. The continuation case still depends on buyers defending the breaker and restoring strength above $2,800.
$3,447 ERL Depends on the Breaker Holding as Support
The $3,447.44 external range liquidity remains the main upside objective marked on the weekly chart. From $2,668.39, reaching that level would represent an advance of roughly 29%.
However, the target remains conditional on the reclaimed structure holding. A pullback toward the breaker would test whether buyers continue defending the area around the $2,300 equilibrium.
If the breaker holds, renewed strength through roughly $2,800 would preserve the charted continuation toward the upper ERL. The setup therefore follows a defined technical sequence.
At the charted price, $ETH sits about $368 above the breaker equilibrium and roughly $779 below the upper external range liquidity. That distance keeps the retest as the nearer technical event.
Macro conditions remain relevant. U.S. Treasury yields surged on September 28, with the 30-year yield reaching its highest level since May 2004. The 10-year yield also touched its highest level since June 2007 as markets priced in additional Federal Reserve tightening.
For the current Ethereum setup, the wider breaker remains the dividing line. Holding that zone preserves the chart’s path toward $3,447.44, while sustained acceptance below it weakens the structure.
FAQ
$ETH remains above the breaker zone, keeping the bullish structure intact for now.
It acts as the key support zone, and a retest will confirm if buyers remain in control.
The setup suggests a move toward $2,800 first before any potential continuation higher.
Losing that level would weaken the structure and reduce the likelihood of further upside.
Strong inflows reflect growing demand, but price still depends on technical levels holding.
Related: Ethereum Price Live: $ETH Eyes $3,400 as Exchange Supply Hits Record Low
