

The market’s short-term trigger is a test of resistance in the $82,000–$86,000 range. The asset is now trading close to the pattern’s neckline at $82,266.
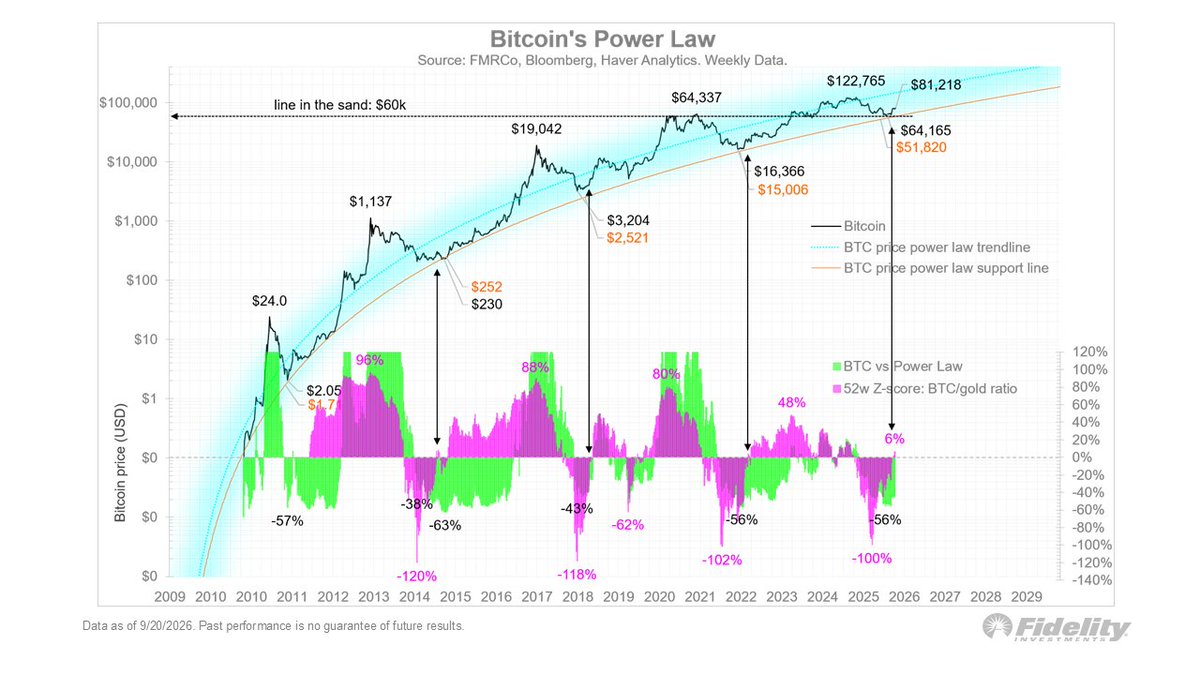
Analysts estimate that a decisive move above $82,500 would trigger a technical push toward the psychological $100,000 mark. For Wall Street, this breakout would signal the end of the capital accumulation phase.
Timmer’s forecast is based on the Power Law model, which evaluates Bitcoin using logarithmic linear progression and a 52-week Z-score of its ratio to gold. The model shows that current price fluctuations are not random noise but regular cycles. Even previous deep drawdowns of 56% and 63% fit entirely within the framework of this trajectory.
Fidelity nevertheless traditionally reminds investors of the risks: the asset remains highly volatile, and past performance does not guarantee future returns. Bitcoin’s aggressive nature calls for strict diversification, but Timmer’s macro model makes one thing clear: Bitcoin’s trend follows strict mathematical principles, not the panic of retail investors.
