


The Ethereum ($ETH) Rainbow Chart suggests $ETH could trade at approximately $2,551 by the end of September 2026, placing the cryptocurrency in the model’s Accumulate zone.
With Ethereum trading around $2,400 as of press time, the projection implies a potential upside of about 6% over the remainder of the month.
Notably, the outlook is based on BlockchainCenter’s Ethereum Rainbow Chart, a long-term valuation model that uses Ethereum’s price history since 2015 to assess whether $ETH is trading below, near, or above its historical growth trend.
According to the September 2026 Rainbow Chart bands, ‘Basically a Fire Sale’ ($1,134) signals extreme undervaluation; ‘BUY!’ ($1,700) indicates a buying opportunity, ‘Accumulate’ ($2,551) suggests gradual accumulation, and ‘Still cheap’ ($3,826) points to continued undervaluation.
Higher bands include ‘HODL!’ ($5,739), which reflects fair-value holding territory. ‘Is this a bubble?’ ($8,608), which signals rising speculation, and ‘FOMO Intensifies’ ($12,912), where investor exuberance becomes more pronounced.
The top bands: ‘Sell. Seriously, SELL!’ ($19,368) and ‘Maximum Bubble Territory’ ($29,052), indicate historically overheated market conditions.
Ethereum price analysis
The prediction comes as Ethereum retreats from recent highs above $2,500, which coincided with a broader cryptocurrency market rally led by Bitcoin (BTC).
At press time, $ETH was trading at $2,368, down about 3.4% over the past 24 hours and 3.2% on the weekly timeframe.
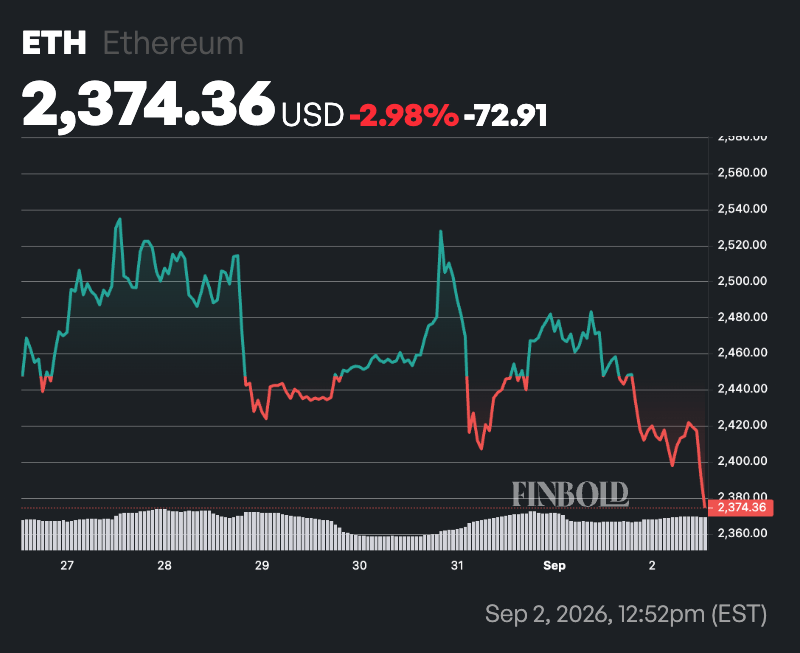
Even so, Ethereum remains in a technically strong position despite the bearish sentiment. The asset continues to trade well above its 50-day SMA of $2,043 and 200-day SMA of $2,027, indicating that the medium- and long-term trends remain bullish.
Momentum also remains supportive, with the 14-day RSI at 63.92. While still in neutral territory, the indicator is approaching overbought levels, suggesting buyers remain in control even as the pace of gains may begin to moderate.
Featured image via Shutterstock
