
That recovery keeps the wider range intact, although price analysis cannot establish permanent support before the candle closes. Its midpoint near $78,020 divides the structure into upper and lower halves.
As of press time, Bitcoin stood above that midpoint around $80,024, indicating a recovery within the range rather than a breakout. For $BTC, price analysis now distinguishes holding the midpoint from clearing the substantially higher $97,924 ceiling.
Weekly Breaker at $82,000–$83,000 Tests Bitcoin’s Recovery
On the weekly chart, Bitcoin remained inside a $78,000–$83,000 breaker zone following October’s retreat from approximately $87,000. $BTC therefore faces immediate resistance around $82,000–$83,000, where the chart previously marked a break of structure.
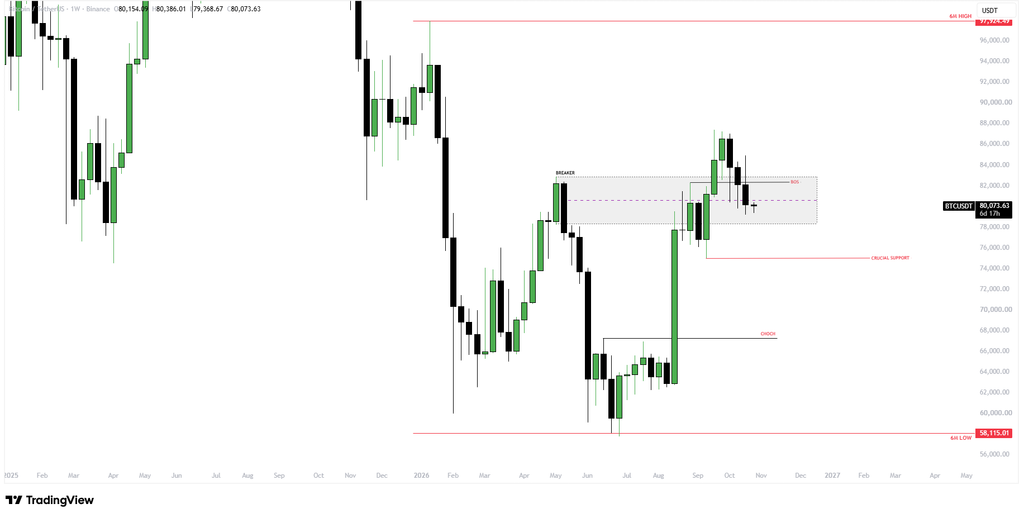
This price analysis places the next resistance band at $87,000–$90,000 before the six-month high. Nevertheless, Bitcoin has not reclaimed those levels, making $97,924 a conditional upside objective.
Meanwhile, a rejection near the breaker would shift attention toward $75,000, followed by the change-of-character area around $67,000. For $BTC, price analysis therefore separates a defended range floor from a confirmed weekly bullish trend.
Follow us on X for real-time crypto updates.
Bitcoin Holds Above $80K Support as ETF Outflows and Fed Meeting Loom
That distinction matters alongside Coinbase Institutional’s October 23 commentary, which identified $80,000–$82,000 as near-term support and $73,000–$75,000 as a lower-risk area. The firm also noted that about 2.1 million $BTC last moved between $87,500 and $91,700, leaving overhead supply.
ETF flows add another layer of uncertainty. Farside Investors reported $137.9 million in US spot Bitcoin ETF outflows on October 23, continuing the previous day’s $635.6 million in outflows.
With the Federal Reserve meeting scheduled for October 27–28, traders also face another potential source of volatility. Bitcoin remains above its $58,115 six-month floor, but the recovery toward $97,924 would gain stronger technical support only if $BTC reclaims weekly resistance.
$BTC’s Key Market Indicators
Bullish Continuation
Weekly acceptance above $83,000, followed by $87,000–$90,000, strengthens the recovery toward $97,924.
Bearish Breakdown
Yet, a loss of $78,020 exposes $75,000 and $67,000, while a decisive break below $58,115 invalidates the range-floor thesis.
FAQs
1. Why Is $58,115 Important?It marks Bitcoin’s six-month structural floor, as shown in TradingView’s Binance chart.
2. Is $97,924 a Confirmed Target?No. It remains the conditional upper-range objective.
3. What Confirms Bullish Momentum?A sustained $BTC weekly close above $83,000 would push Bitcoin to higher resistance levels around $87,000–$90,000.
4. What Is Bitcoin’s Immediate Support?Coinbase Institutional identified $80,000-$82,000 as $BTC’s immediate support zone.
Subscribe to our YouTube channel for the latest crypto news.