
In brief
- Bitcoin touched roughly $62,100 on Sunday, its lowest level since July, as about $2 billion in crypto positions were liquidated over a 24-hour weekend period.
- U.S. spot Bitcoin ETFs saw about $1.91 billion in outflows over seven consecutive trading sessions through November 13, according to Farside Investors.
- Deribit data show more than $800 million in open Bitcoin put contracts at the $60,000 strike, though much of that exposure extends into December.
Bitcoin fell to around $62,100 on Sunday as roughly $2 billion in crypto derivatives positions were forcibly closed, mostly bets on rising prices. The weekend decline took the cryptocurrency to its lowest level since July 14, adding another difficult chapter to six straight weeks of losses.
Bitcoin had rebounded to around $64,300 by early Monday. Still, options market activity suggests traders are not necessarily viewing the bounce as an all-clear.
A liquidation occurs when an exchange closes a trader's position because the funds posted to back a leveraged bet are no longer sufficient to cover its losses. CoinGlass data for Saturday showed $1.9 billion liquidated over one 24-hour period, including about $1.8 billion in bullish positions across cryptocurrencies, not Bitcoin alone.
Seven red days for Bitcoin ETFs
U.S. spot Bitcoin ETFs had been seeing outflows even before the weekend. Decrypt's ETF tracker recorded $185.4 million in net outflows on Friday, extending the streak to seven trading sessions and bringing withdrawals since November 5 to approximately $1.91 billion.
BlackRock's IBIT accounted for $143.5 million of Friday's outflows, while Fidelity's FBTC saw $41.9 million withdrawn. The funds' earlier weakness helped explain the broader outflow, although ETF flow figures track fund creations and redemptions, not every transaction between investors.
There is also a timing distinction: U.S. ETFs do not trade on weekends, while Bitcoin trades around the clock. Friday's outflows point to weaker demand before the crash, not to ETF shareholders redeeming shares during Sunday's drop.
Bitcoin's $62,000 support faces another test
Bitcoin's technical indicators suggest selling may be overstretched, but that does not necessarily mean the worst is over.
The daily Relative Strength Index was near 24, in oversold territory on daily charts. The Average Directional Index was above 33, signaling a strong prevailing trend, with bearish pressure still dominant. The weekly RSI, near 38, indicated a weak longer-term picture, though it had not entered oversold territory.
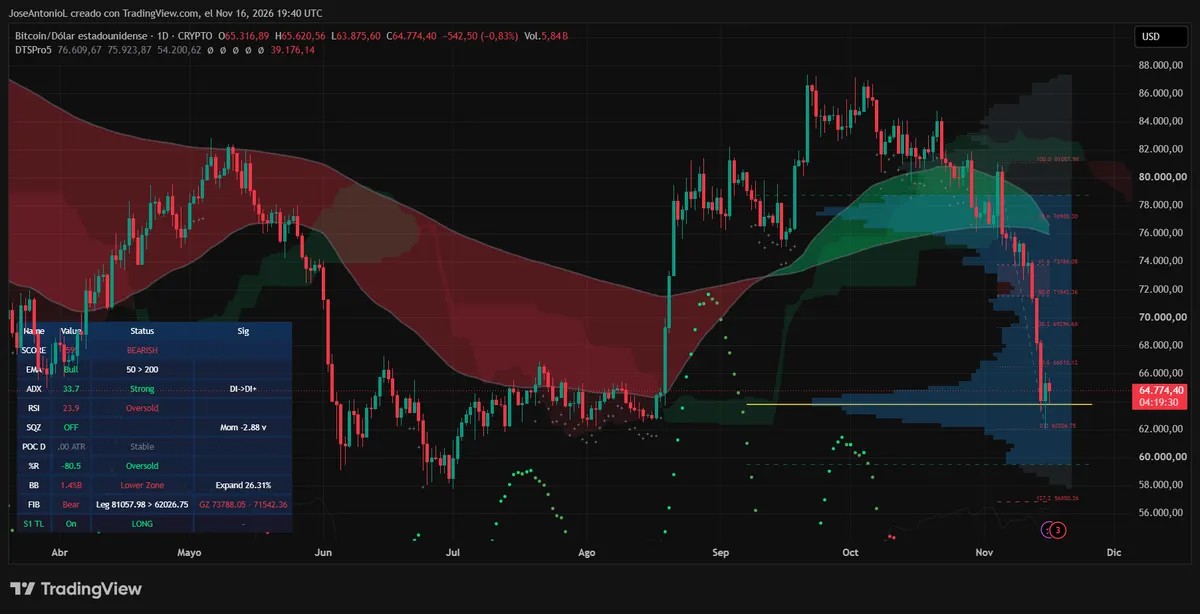
The cryptocurrency rebounded after nearing support around $62,000. A recovery could meet resistance around $66,500 to $67,200, with another potential obstacle near $69,300, based on Fibonacci levels used to identify support and resistance.
A decisive drop below $62,000 would, meanwhile, bring the psychologically important $60,000 level back into focus, where options traders have built significant downside exposure.
Bitcoin's next test will be whether fresh U.S. ETF flow data show further outflows on Monday and whether traders continue paying for downside protection. The closely watched November 27 options expiration is still ahead, with $50,000 puts among the contracts seeing the most recent trading activity.
Disclaimer
The author's views and opinions are for informational purposes only and do not constitute financial, investment or other advice.