
Extreme Fear Prompts Contrarian Assessment
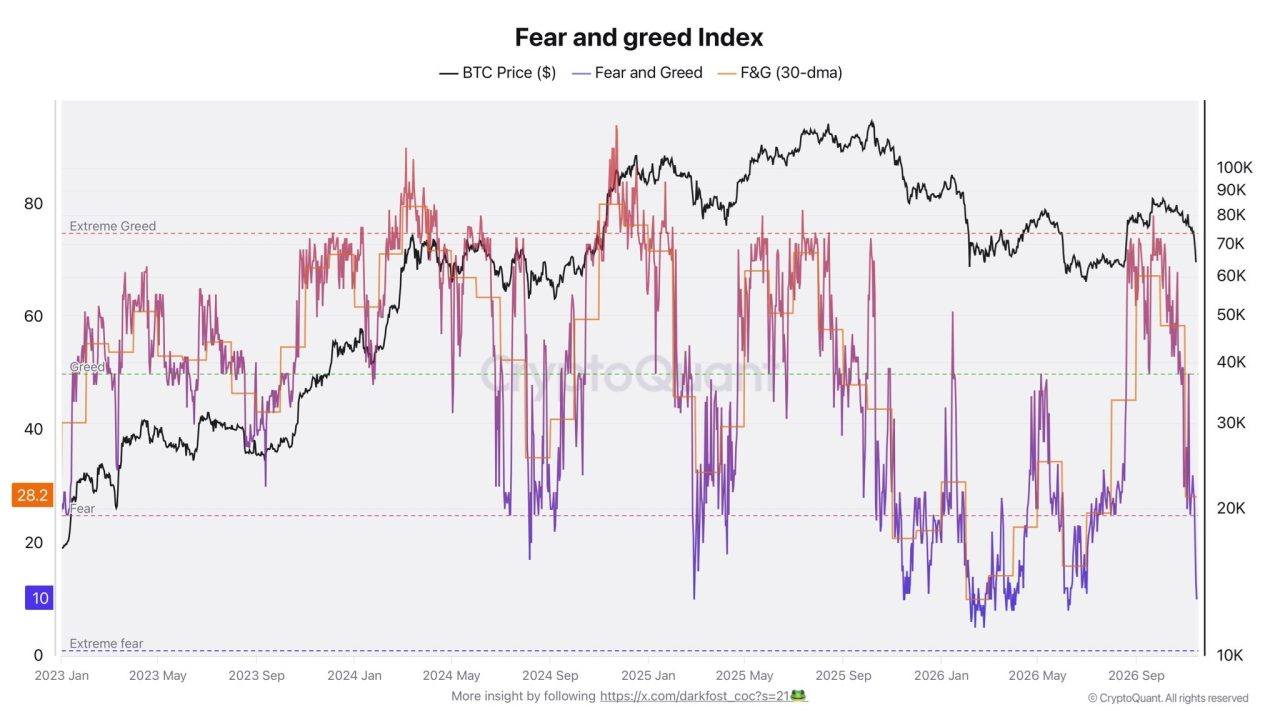
Extreme fear dominated bitcoin sentiment as Cryptoquant contributor Darkfost pointed to a potential contrarian signal on X on Nov. 16, writing:
“Extreme fear has finally taken over the market.”
He added: “With a score of 10, the Fear and Greed Index shows that Extreme Fear is now dominating investor sentiment on bitcoin.” He said the Fear and Greed Index’s 30-day average was 28.2, nearing readings seen in February and June, when bitcoin had traded lower.
In bitcoin market analysis, a contrarian signal runs counter to prevailing sentiment, suggesting widespread pessimism could precede a rebound. Comparing daily readings with a 30-day moving average, which smooths daily fluctuations, the analyst said:
“This gives us an interesting contrarian signal right now.”
The analyst also shared a chart tracking bitcoin’s price alongside the Fear and Greed Index and its 30-day average. The latest sentiment reading of 10 was below the average of 28.2, indicating that daily sentiment had worsened more sharply than the broader monthly trend.
Santiment separately recorded bearish sentiment for bitcoin, ether, and $XRP on Nov. 10. For every 100 bearish comments, there were 82 bullish comments about bitcoin, 88 about ether, and 49 about $XRP. The analytics firm also interpreted the pessimism as potentially favorable for a recovery.
Three Gauges Show Widespread Pessimism
Alternative.me’s Fear and Greed Index was 10 on Nov. 16, unchanged from Sunday, compared with 29 a week earlier and 55 a month earlier. Its scale runs from zero to 100 and measures sentiment, with lower scores indicating greater fear. Its inputs include volatility, or price fluctuations, and momentum, the strength and direction of price movements.
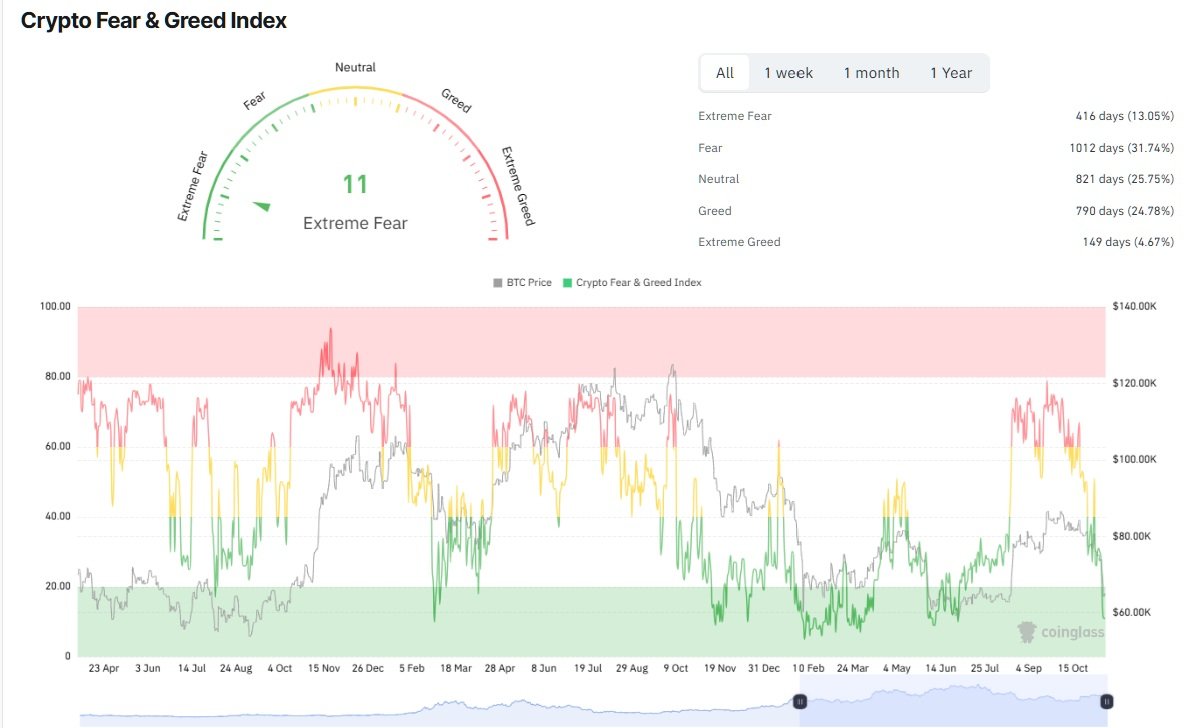
Coinglass showed a sentiment reading of 11, classified as extreme fear, alongside bitcoin’s price history. Extreme fear accounted for 416 days, or 13.05%, of the historical sample shown, compared with 31.74% for fear and 4.67% for extreme greed.
At the time of writing, Coinmarketcap’s separate gauge was 13, after reaching 12 earlier Monday. That was down from 29 a week earlier and 50 a month earlier. Its range over the year was 5 on Feb. 5 to 82 on Aug. 26. Its inputs include expected price swings, demand for put and call options, bitcoin’s value relative to stablecoin supplies, and search and engagement data.
Fund Outflows Complicate the Recovery Case
On Sunday, Nov. 15, Binance co-founder and former CEO Changpeng Zhao cited possible pressures behind the crypto sell-off, including roughly $1.9 billion in U.S. spot bitcoin fund outflows over seven sessions through Nov. 13. He also mentioned security concerns, inflation, politics, and competition for capital from initial public offerings. Zhao stressed that the cause was uncertain.
In its Nov. 11 analysis, Glassnode identified a concentration of vulnerable bullish trades between $59,500 and $62,600. The liquidation cluster marked prices at which many leveraged trades could be forcibly closed, adding selling pressure.
Glassnode described buying as uneven, with accumulation among wallets holding 100-1,000 $BTC and 1,000-10,000 $BTC, while smaller holders and the largest group reduced their balances. By Nov. 14, the firm said stablecoin supply had contracted by $17 billion over a month.
Bitcoin recently traded near $65,000, down more than 13% over the past week, though up from a recent weekend low near $62,000.