
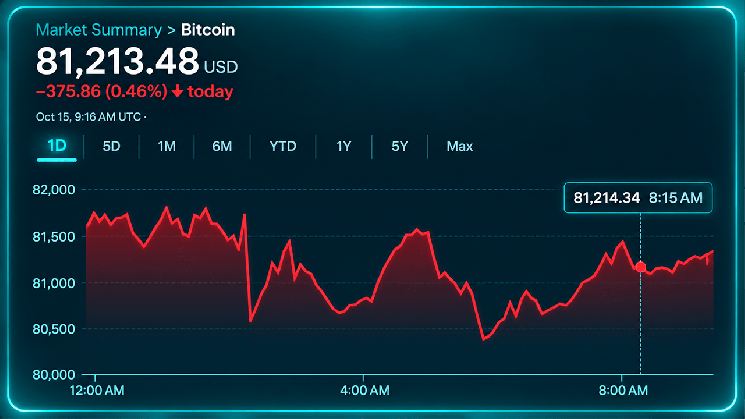

Buyers have managed to stabilize the market above the session’s deeper lows, but the recovery lacks the momentum necessary to overturn the bearish structure. Another rejection below $81,800 would place $80,500 back on the radar, followed by the closely watched $80,150 support area.
Four-Hour and Daily Charts Keep Bears in Charge
The four-hour chart offers little comfort for traders anticipating an immediate recovery. Lower highs continue to characterize the broader structure, while repeated failures to sustain advances above $83,500 reveal persistent selling interest.
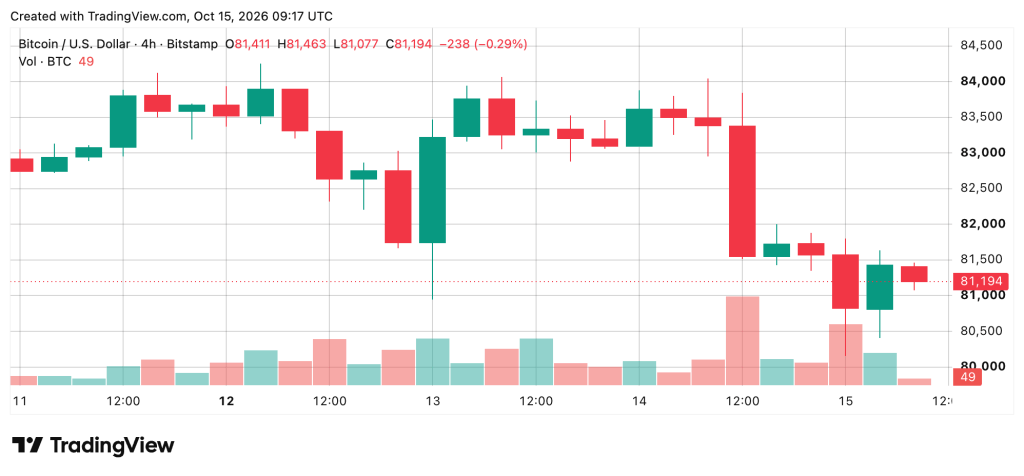
A pronounced bearish candle accompanied by elevated trading volume reinforces the significance of the recent breakdown. Reclaiming $82,000 would represent an initial improvement, although $82,500 remains the more consequential recovery threshold. Until those levels are recovered, the evidence favors corrective rebounds rather than a decisive change in direction.
The daily chart presents an equally demanding assignment for buyers, with bitcoin surrendering much of its previous advance from $74,913 to $87,374. Recent candles reflect deteriorating momentum, leaving $80,000 as the principal defensive line.
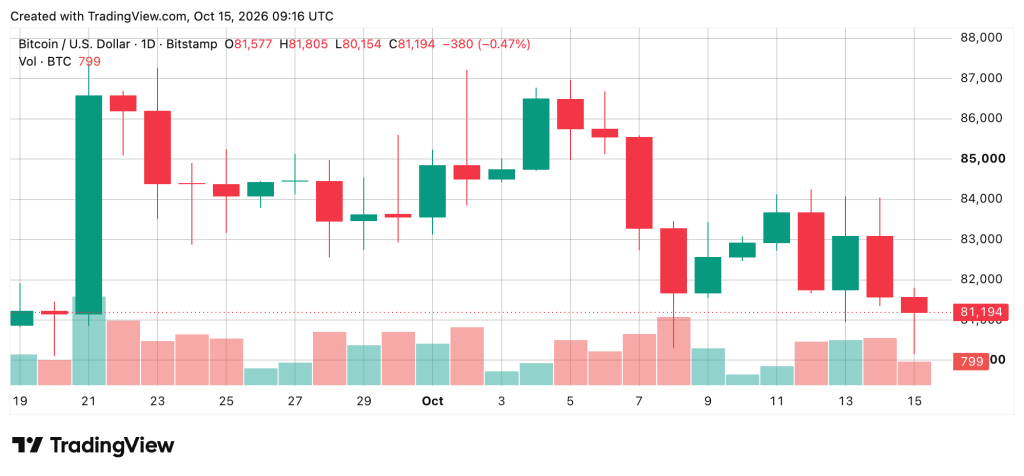
A daily close below that psychological barrier would expose $79,000 and potentially $78,000, while a sustained recovery above $81,800 would improve the immediate outlook. The larger technical question is whether buyers can establish a durable floor before the latest selling pressure develops into another downward extension.
Oscillators and Moving Averages Deliver Mixed Signals
Bitcoin’s oscillators remain predominantly neutral despite the recent retreat. The relative strength index (RSI) stands at 46, while Stochastic registers 25, and the commodity channel index (CCI) reads minus 163.
The average directional index (ADX) sits at 26, suggesting some directional strength without independently establishing its direction. Momentum registers a positive signal at minus 4,516, although moving average convergence divergence (MACD) remains negative at 266. The ultimate oscillator (UO) reads 43, reinforcing a market where bearish pressure persists without unanimous confirmation across indicators.
The daily chart’s moving averages (MAs) tell a more distinctly bearish short-term story. Bitcoin trades beneath the 10-period exponential moving average (EMA) at $82,635 and the 20-period exponential moving average (EMA) at $82,801, while the 20-period simple moving average (SMA) stands higher at $83,662.
Longer-term readings remain constructive, with the 50-period exponential moving average (EMA) at $80,297 and the 200-period simple moving average (SMA) at $72,282. That division leaves traders confronting a market whose immediate direction remains weak despite a more supportive longer-term foundation.
