


It could be a sign of a local low. The market sentiment remained in greedy territory, but this week could bring heightened volatility with the CPI report and rate hike expectations.
The $82k supply zone has not yet been convincingly overturned, either. Long-term holder behavior suggested profit-taking.
The surprising Bitcoin reaction to selling pressure
The 30-day change in long-term holder supply had been positive in July, but the trends began to shift around the start of August. As Bitcoin rallied higher past $75k, the LTH supply grew more negative.
Since the start of August, the long-term holder supply has fallen by 98.5k $BTC, observed crypto analyst Axel Adler Jr. It was a sign of profit-taking and sell pressure on the market.
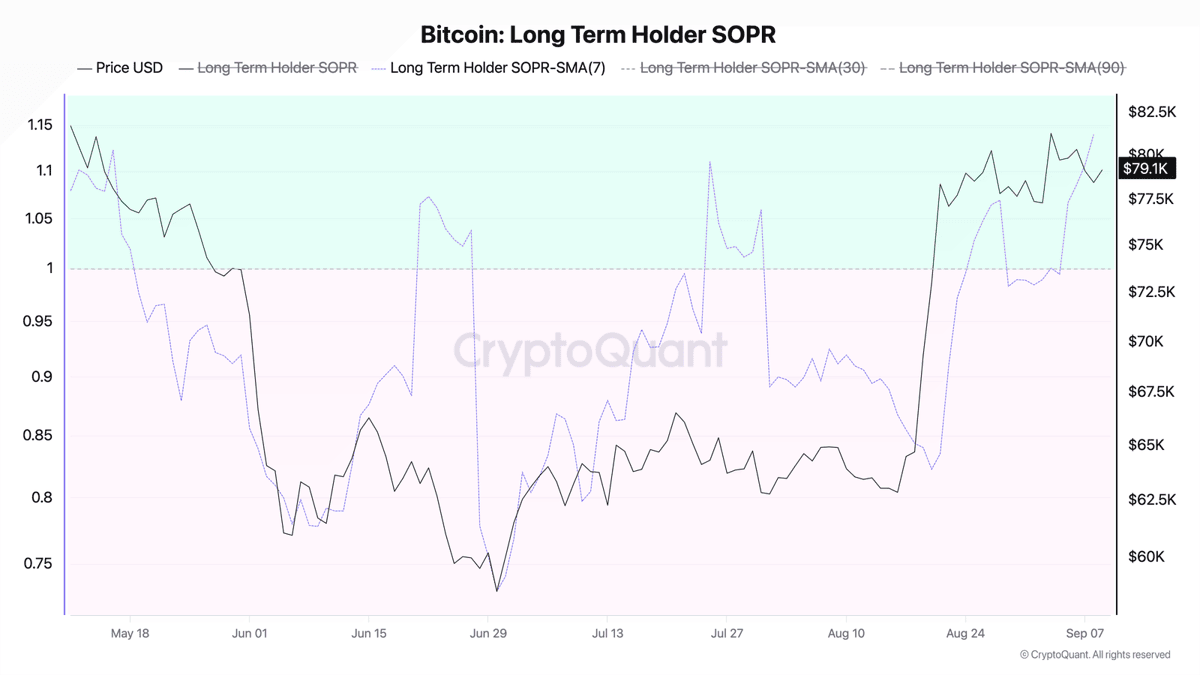
The rally beyond $80k saw the Spent Output Profit Ratio cross above one to reach 1.14 in September. In other words, long-term holders’ realized profits exceeded realized losses, another indication of profit-taking.
Bitcoin is holding up well despite the selling
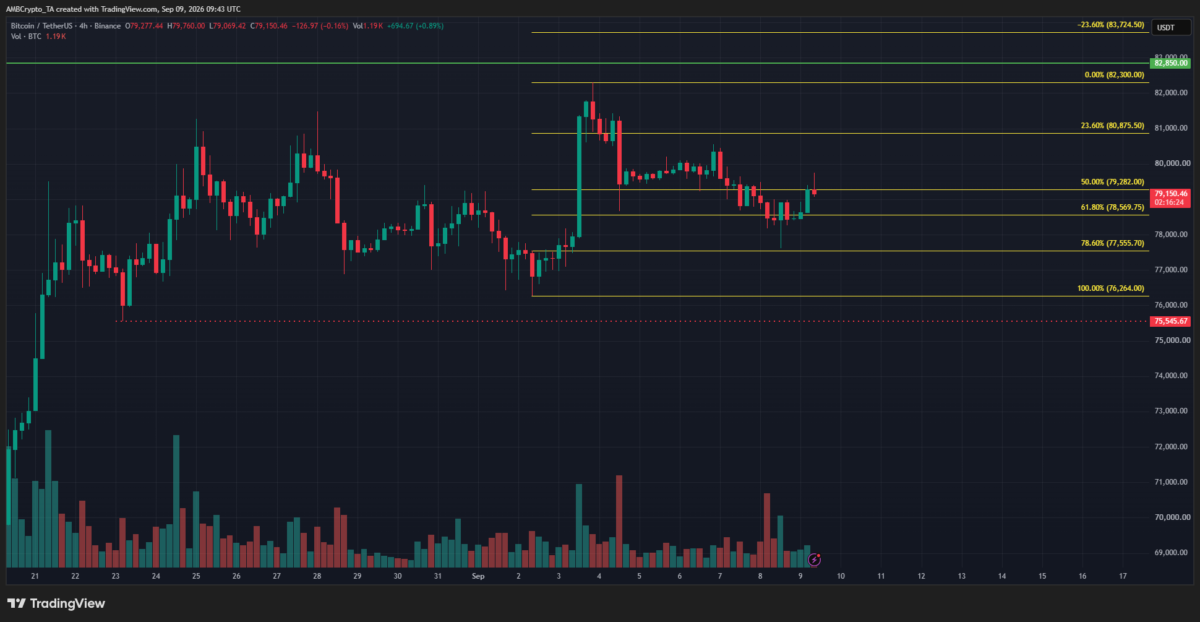
The 4-hour chart has a bullish structure. The past few days’ selling saw a retracement to $77,620, just above the 78.6% retracement level at $77,555. The swing high from May at $82,850 remains the key overhead supply zone to watch.
The fact that Bitcoin maintained its bullish H4 structure despite long-term holder profit-taking meant that demand was able to absorb the selling. This was a good sign of strength from the bulls.
Final Summary
- Bitcoin saw a 5.7% retracement in five days to fall to $77,620.
- Despite evidence of long-term holders taking profits and selling into bullish strength, the $BTC price continued to hold up well above the $76k demand zone.
