


Liquidity manipulation halts $BTC price upside
Data from TradingView showed $BTC/USD dropping below $82,700 for the first time since Sept. 21.
$BTC/USD four-hour chart. Source: Cointelegraph/TradingView
After posting its highest weekly close since late January at around $84,450, the pair failed to mount another test of its eight-month highs above $87,000 seen last week. Instead, a large patch of ask liquidity appeared, with over $30 million clustered around $85,700. Sudden, conspicuous liquidity at a price level often signals a calculated attempt by large traders to influence price direction.
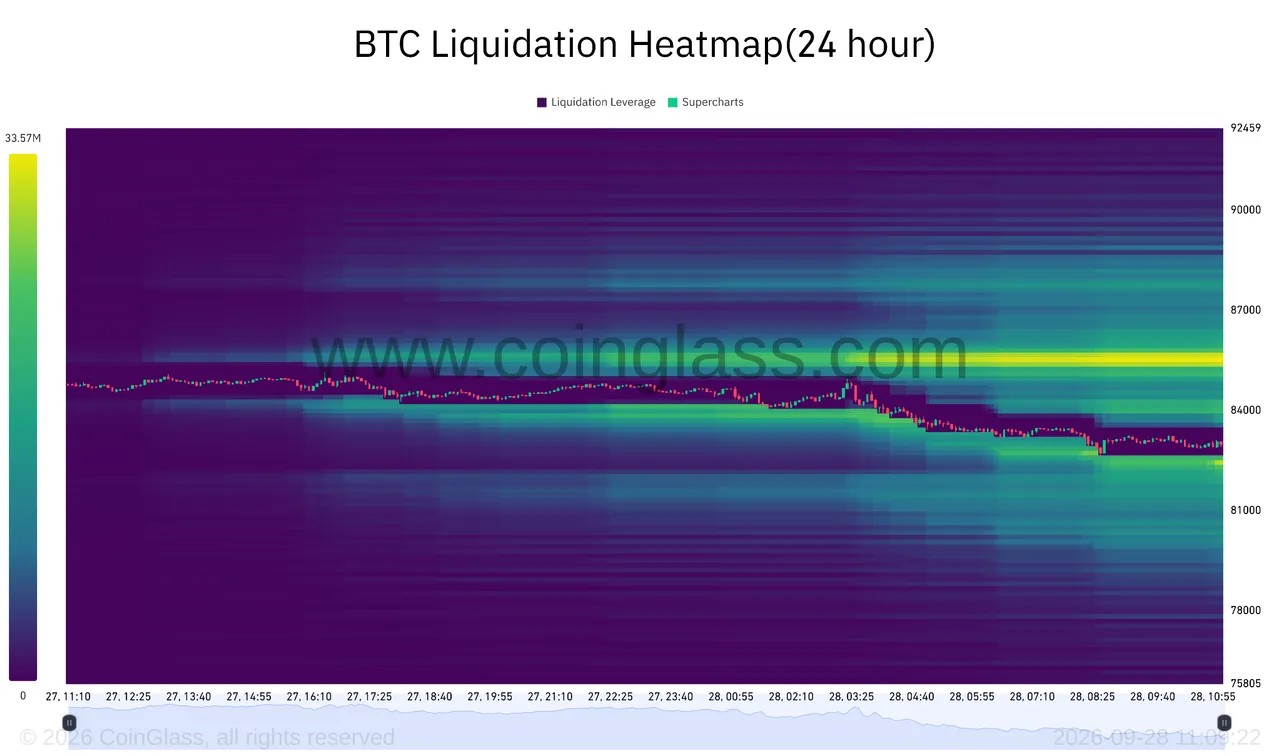
$BTC liquidation heatmap. Source: CoinGlass
Data from CoinGlass showed the drop liquidating nearby long positions, totaling around $70 million over 24 hours at the time of writing.
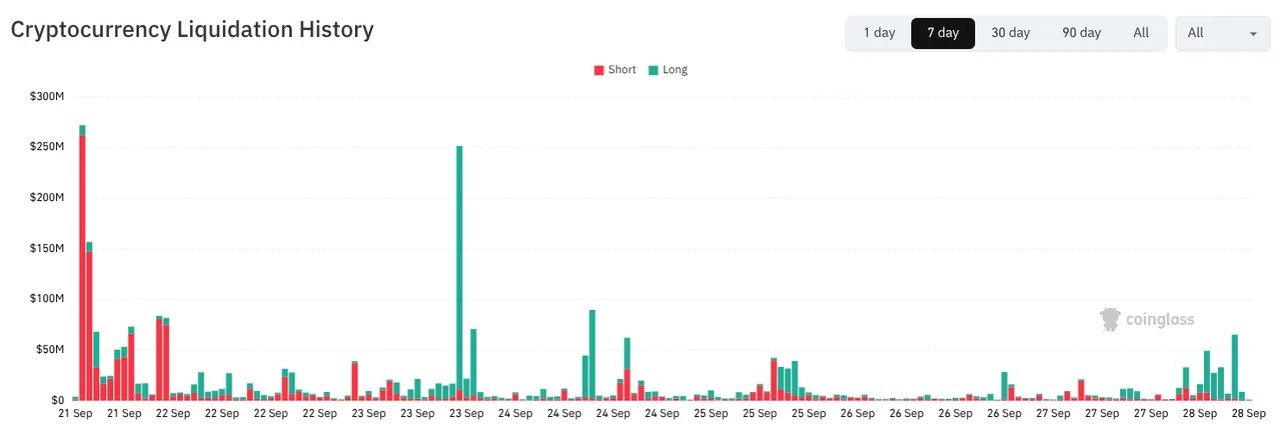
Crypto liquidation history (screenshot). Source: CoinGlass
Bitcoin weakness accompanied downside in US stocks futures after president Donald Trump refused to rule out further military strikes on Iran.
“I don’t want to say that. I don’t want to say that. I mean, it’s possible, but I just don’t want to say that,” he said at the PGA Tour Presidents Cup on Sunday, quoted by Fox News.
Nasdaq futures were down 0.9% on the day at the time of writing, while WTI crude oil passed $95 per barrel for the first time since Sept. 24.
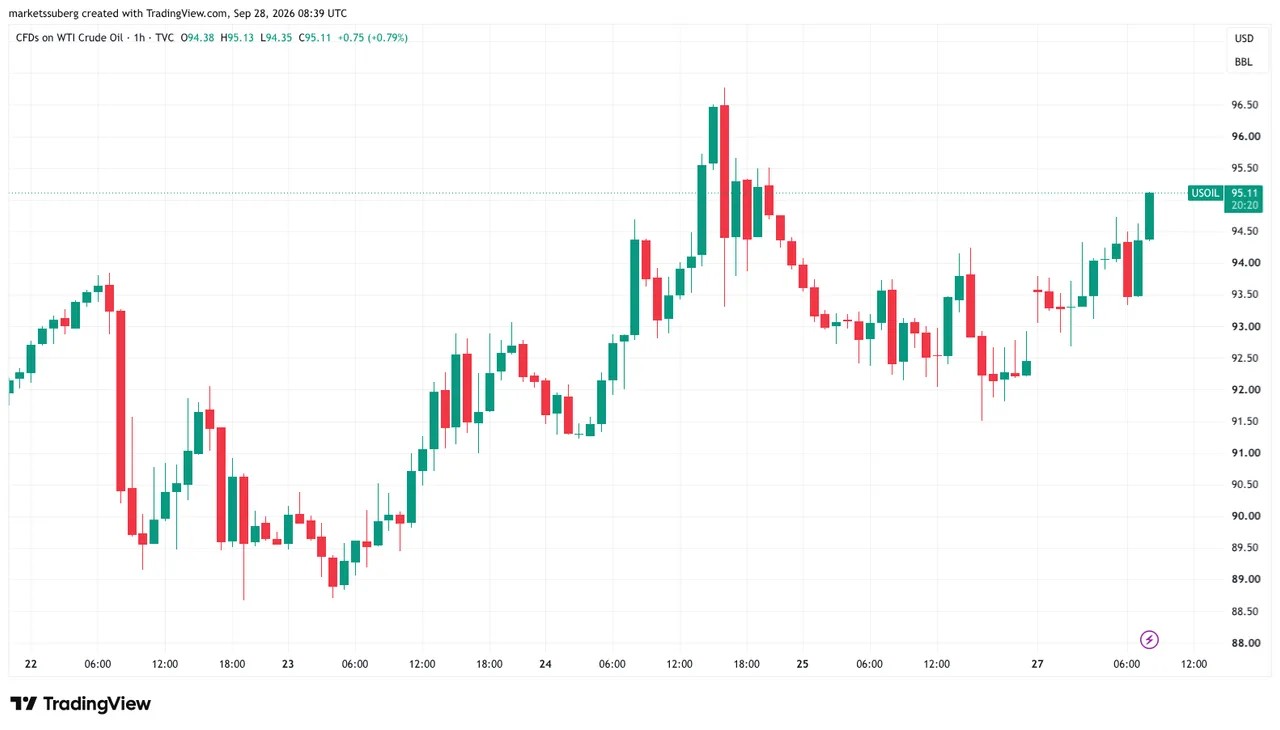
CFDs on WTI crude oil one-hour chart. Source: Cointelegraph/TradingView
Yearly open next challenge for Bitcoin bulls
The $85,700 level blocked a renewed push toward the 2026 year-open level at $88,700, where price stalled last week.
Related: Here’s what happened in crypto today
Prior to the weekly close, trader Aksel Kibar warned that Bitcoin’s performance did not resemble a “decisive breakout,” even prior to dropping below $83,000.
“Hesitant price action here can result in price returning inside the range,” he wrote in a post on X, referring to the area between $60,000 and $80,000 where $BTC/USD traded for much of 2026.
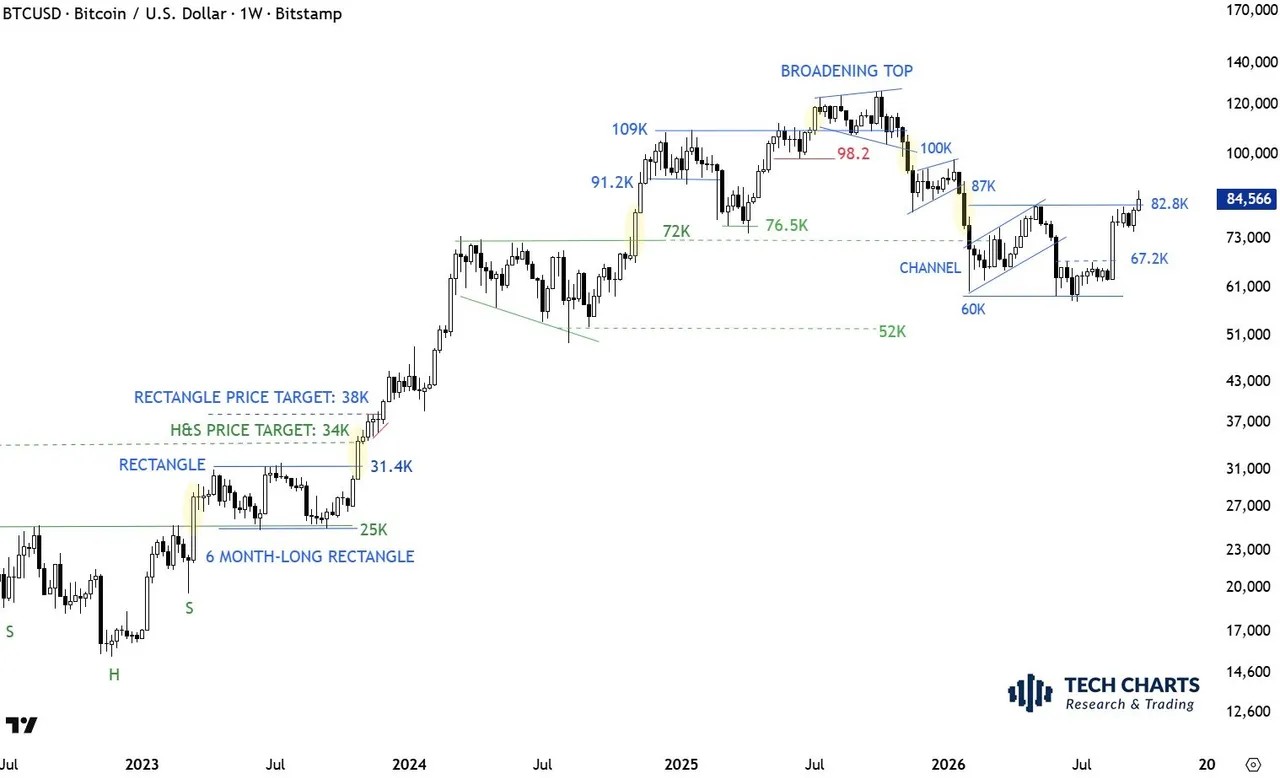
$BTC/USD one-week chart. Source: Aksel Kibar on X.com
