
Bitcoin’s price outlook for November 14 remains bearish below $70,000. BTC needs to reclaim that level after losing its rising trendline.
Bitcoin Price Analysis: Can $BTC Climb Back to $70,000?
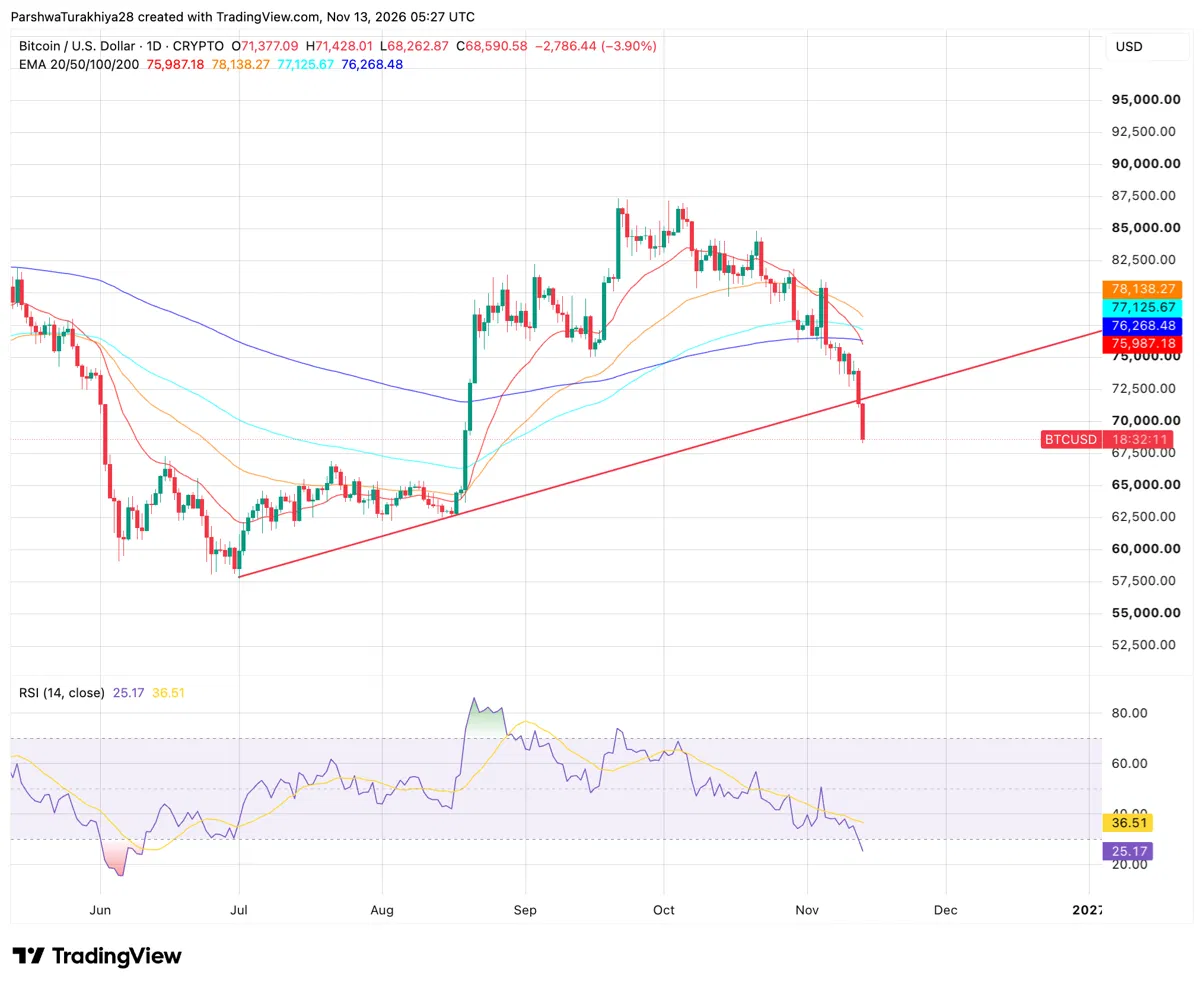
Bitcoin’s drop below $70,000 leaves buyers facing a difficult recovery after the rising trendline broke. BTC is trading at $68,686, down 7% in 24 hours, according to CoinGecko, and is roughly 21% below its late-September high.
The trendline from July’s low broke on November 12, and selling continued into the next session. The line now sits near $71,700, making $70,000 to $71,700 the first resistance zone buyers need to reclaim.
All four daily moving averages remain well above the price, underscoring the weakness. The 20-day EMA is at $75,987, followed by the 200-day at $76,268, the 100-day at $77,126 and the 50-day at $78,138.
The RSI has fallen to 25.17, below both the oversold threshold of 30 and its average of 36.51. This leaves room for a relief bounce, but the chart has yet to show a clear reversal.
Related: Lombard Price Prediction: BARD Surges 61% as Buying Pressure Returns
For November 14, the setup points to a range of $65,000 to $70,000 while BTC stays below former support. A sustained recovery above $70,000 would put $71,700 in focus, while a daily close below $65,000 could expose $62,500.
$BTC Support and Resistance Levels, November 14, 2026
| Type | Price | Why it matters |
| Resistance | $70,000 | Round level, former support |
| Resistance | $71,700 | Broken rising trendline |
| Resistance | $75,987 | 20-day EMA |
| Support | $68,263 | Today’s low |
| Support | $65,000 | Round level |
| Support | $62,500 | August low |
US Bitcoin ETFs Lose $1.44B in Five Straight Sessions
US spot Bitcoin ETFs have seen $1.44 billion in outflows over five consecutive sessions, including $299.90 million on November 11. Their last inflow was $74.57 million on November 4.
Total net assets dropped from $102.26 billion to $93.70 billion, a decline of about 8.4%. Outflows account for only about 17% of the drop, meaning most of the loss came from the falling price.
The latest figures are incomplete. Partial data for November 12 shows another $47.61 million in outflows, while Fidelity’s FBTC and BlackRock’s IBIT, the two largest funds, have yet to report.
Dollar Index Tops 103 as Fed Hike Odds Rise
CoinDesk reported that the selloff accelerated as the US Dollar Index (DXY), which tracks the dollar against major currencies, climbed above 103, its highest level since April 2025. The index has risen nearly 2% since early October as expectations of Fed rate hikes strengthen.
Expectations of a half-point rate hike in December have increased since an October CPI reading earlier this week came in hotter than expected. CoinDesk also cited media reports of renewed military escalation in the Middle East, with Iran’s IRGC saying it destroyed a US early-warning radar in Bahrain.
Higher rate expectations drain liquidity from assets such as Bitcoin, so a continuing rise in the dollar leaves little room for a bounce above $70,000.
Nvidia’s CEO Exits, but Bitcoin Was Already Falling
In an SEC filing, Nvidia said CEO Jensen Huang had resigned as president, chief executive and board member, effective immediately. CFO Colette Kress becomes interim CEO, and Harvey C. Jones becomes the board’s first-ever chair. Nvidia shares fell 6.4% in early trading and are down 18.8% over the past week.
Bitcoin’s decline began earlier. It closed at $80,428 on November 4, fell to $75,969 the next day and reached an intraday low of $72,643 on November 10. It is trading near $68,686 today, about 15% below its November 4 close. The Nvidia news adds to a tech-led risk-off move rather than starting it.
Coinbase Bitcoin Premium Stays Negative for 50 Days
Odaily, citing CoinGlass data, reported that the Coinbase Bitcoin premium index has been negative for 50 consecutive days. It was -0.13% on November 12, compared with a 30-day average of -0.15%.
Related: Gram (prev. Toncoin) Price Prediction & Forecast 2026, 2027, 2028, 2029, 2030
The index measures the price difference between Coinbase and Binance. A negative reading usually indicates weaker US buying or stronger US selling. The gap is small, pointing to steady, mild weakness in US demand rather than panic, and aligns with the ETF outflows.
Bitcoin Price Prediction Scenarios for November 14
Bullish Case, Target: $71,700
BTC holds today’s low of $68,263, closes above $70,000 and reclaims the broken trendline near $71,700, about 4% above today’s price. A close above that level would bring the 20-day EMA at $75,987, about 11% higher, into view. A pause in ETF outflows and a softer dollar would be consistent with this scenario.
Bearish Case, Risk Level: $65,000 (Round Level)
BTC closes below today’s low of $68,263 and then below $65,000, about 5% below today’s price. That could bring the August low near $62,500, about 9% lower, into play. A sixth consecutive session of ETF outflows and a stronger dollar would be consistent with this scenario.
FAQs
What is the Bitcoin price prediction for November 14, 2026?BTC remains bearish below $70,000 and could move toward the broken trendline near $71,700 if it holds today’s low at $68,263 and closes above $70,000. A daily close below $65,000 would put $62,500 in play.
Why is the Bitcoin price falling?BTC is down 7% over 24 hours at $68,685.80, according to CoinGecko, and has broken below its rising trendline. The decline coincides with the dollar index above 103, higher Fed rate-hike expectations following a hot CPI report, and $1.44 billion in ETF outflows over five sessions, though the data do not link the drop to any single cause.
Are Bitcoin ETFs seeing outflows?According to SoSoValue, US spot Bitcoin ETFs saw $299.90 million in outflows on November 11 and $1.44 billion over five consecutive sessions. Partial data for November 12 shows a further $47.61 million in outflows.
What is the key support level for Bitcoin?Today’s low at $68,263 is the first support level, followed by $65,000. A close below $65,000 would put the August low near $62,500 in play.