
Bitcoin has climbed back above $64,000 after briefly dipping toward $62,000. The rebound remains modest, but a projection on the weekly chart suggests $BTC could rise as high as $80,000 before moving toward the $57,000 region. Such a rally would return Bitcoin to an area where sellers could re-enter the market, while the weekly structure remains bearish.
Bitcoin Price Breakdown Could Set Up a Potential $80K Recovery
Bitcoin’s problems began when buyers failed to push an earlier recovery beyond $87,000. Since then, the Binance $BTC/USDT weekly chart on TradingView has shown a series of lower highs. Selling pressure continued to build, eventually pushing the cryptocurrency below $74,800.
Much of the recent decline came during a large bearish weekly candle that sent $BTC toward the $62,000 region. Buyers later recovered some of those losses, bringing Bitcoin to $64,758.55 at the time of the analysis.
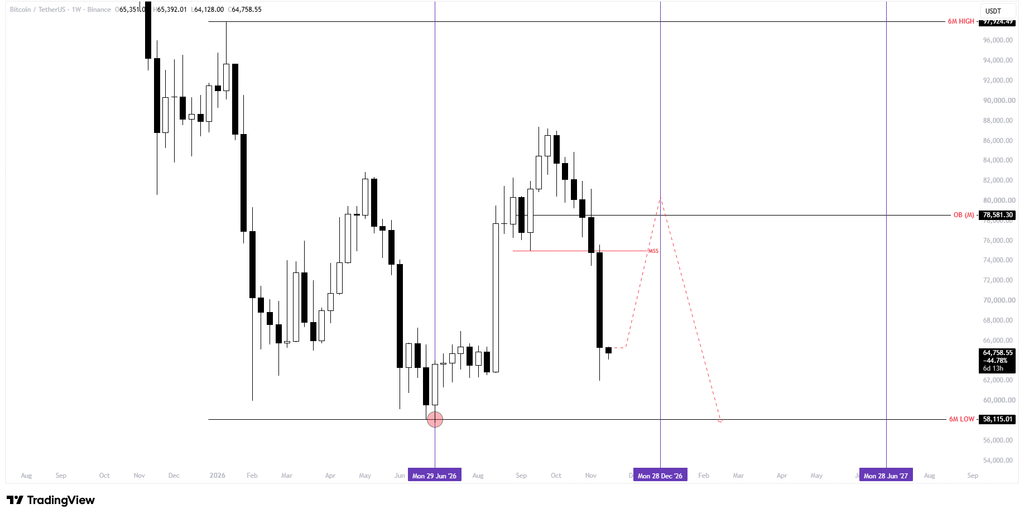
The recovery leaves room for a further retracement, but the immediate question is whether buyers can defend $62,000. If Bitcoin continues to recover, former support around $74,800 could act as resistance, particularly because the level marks a market structure shift (MSS) on the weekly chart.
Follow us on X for real-time crypto updates.
Monthly Order Block at $78,581 Could Cap Bitcoin’s Recovery
The chart also marks $78,581.30, where a monthly order block lies just below the projected recovery target. It shows a possible move toward $80,000 in late December. That would put Bitcoin about 23.5% above its displayed price, although the rally could leave the weekly bearish structure intact.
Bitcoin’s path depends in large part on how $BTC trades around the monthly order block. Selling in that area could lead to another lower high. A break above the earlier peak near $87,000, by contrast, would challenge the bearish projection.
Bitcoin Could Face a Liquidity Sweep Below $58,115 Toward $57K
The June low of $58,115.01 remains untouched. Stop-loss orders may lie below that level, making it a possible target for sell-side liquidity. The chart projects a decline starting near $80,000 and extending below the June low into early 2027.
If the move reaches $57,000, Bitcoin would lose nearly 29% of its value over that stretch. It is also possible that $BTC does not reach $80,000, as renewed selling below $62,000 could bring the June low into focus much sooner.
Bitcoin Price Resistance Levels
| Level | Significance |
| $74,800 | Broken market structure level |
| $78,581 | Monthly bearish order block |
| $80,000 | Projected relief rally target |
| $87,000 | Previous swing high |
Bullish Case
A move back above $74,800 could support Bitcoin’s recovery toward $78,581 and $80,000.
Bearish Case
However, rejection near $80,000 could put $58,115 in view, followed by $57,000.
Neutral Case
Bitcoin could also trade between $62,000 and $74,800 without a decisive short-term breakout.
FAQs
1. Can Bitcoin Price Recover to $80,000?Yes, if buyers reclaim $74,800 and overcome monthly resistance.
2. What Is Bitcoin’s Key Resistance Level?The monthly order block at $78,581 is a key resistance level.
3. Could Bitcoin Fall to $57,000?Yes, rejection near $80,000 could trigger a downside liquidity sweep.
4. What Could Invalidate Bitcoin’s Bearish Outlook?A sustained move above $87,000 could weaken the bearish structure.
Subscribe to our YouTube channel for the latest crypto news.
Related: ASTER Price Rebounds After 26% Crash as CEO Investigates Suspicious Liquidations