
Bitcoin ($BTC) remained under pressure on Monday, trading around $64,500 after falling to $62,006 last week, its lowest level since mid-July.
The cryptocurrency has now posted six consecutive weekly losses, shedding more than 24% of its value since early October as persistent institutional selling and weakening investor confidence weigh on the market.
US spot Bitcoin exchange-traded funds (ETFs) have also seen substantial withdrawals, with combined net outflows exceeding $2.3 billion over the past two weeks.
Bitcoin ETFs see $2.35 billion in outflows as institutional demand weakens
Institutional demand for Bitcoin continued to weaken last week, as US spot ETFs saw another substantial round of withdrawals.
SoSoValue data show that the investment products recorded $1.07 billion in net outflows last week, after $1.28 billion in withdrawals the week before.
The combined $2.35 billion in outflows marks two consecutive weeks of billion-dollar withdrawals.
The continued withdrawals suggest institutional investors are reducing their Bitcoin exposure amid deteriorating market conditions.
If the negative flow trend continues this week, Bitcoin could face further pressure as investors reassess their exposure to risk-sensitive assets.
Bitcoin's latest sell-off has also led to a substantial reduction in leveraged market exposure.
Analysts say the weekend downturn wiped out almost all leveraged positions established since the August rally.
Market sentiment and momentum indicators have fallen to some of their weakest readings in years.
This suggests the recent correction has been particularly severe, forcing traders to unwind positions as prices continued to fall.
However, Bitcoin's deeply stretched indicators could support a short-term relief rally. Even so, a sustained recovery remains uncertain as large Bitcoin holders continue to sell.
In an email to Invezz, Nick Forster, founder and CEO of Derive.XYZ, said Bitcoin's sharp rebound from Sunday's low shows buyers are still willing to step in.
Expert View
The immediate question is whether Bitcoin can hold its recovery above $60K or whether another wave of selling pushes prices towards the July low of $57.7K. Markets are also closely watching US interest rate expectations following another elevated inflation reading, with the Federal Reserve's December meeting approaching.
Founder and CEO of Derive.XYZ
Nick Forster
Bitcoin price outlook: $BTC falls below the 200-week SMA and key Fibonacci support
Bitcoin's weekly technical structure has weakened considerably after six consecutive weeks of losses.
The cryptocurrency has fallen more than 24% since early October, breaking below several important technical levels.
Last week, $BTC closed the weekly candle below its 200-week Simple Moving Average (SMA), currently at $68,194.
The 200-week SMA is widely followed as a long-term trend indicator and has historically drawn attention during major Bitcoin market corrections.
A sustained move below this level suggests the broader technical outlook has weakened. Bitcoin also closed below the 78.6% Fibonacci retracement level at $65,616.
This level is calculated from the August 2024 low near $49,000 and the October 2025 record high of $126,199.
The break below both technical barriers reinforces the bearish outlook and suggests sellers remain in control.
At the time of writing, $BTC is trading around $64,500, below the Fibonacci level. If selling pressure persists, Bitcoin could fall further toward the psychological support level at $60,000.
Momentum indicators on the weekly chart also point to a bearish outlook. The Relative Strength Index (RSI) is around 37, below the neutral level of 50, suggesting sellers have the advantage.
Meanwhile, the Moving Average Convergence Divergence (MACD) histogram recorded a bearish crossover last week, which remains in place.
This indicates that downside momentum continues to dominate the longer-term trend.
However, a recovery above the $65,616 Fibonacci level could allow Bitcoin to test the 200-week SMA near $68,194.
Reclaiming these levels would improve the technical picture, though further confirmation would be needed to establish a sustained bullish reversal.
Bitcoin's daily chart also shows persistent selling pressure, although momentum indicators suggest the decline may be becoming overstretched.
$BTC remains well below its major daily Exponential Moving Averages (EMAs). The 200-day EMA is around $75,946, while the 100-day EMA is near $76,470.
The 50-day EMA is slightly higher, at $76,701. Together, these moving averages form a concentrated resistance zone between approximately $75,946 and $76,701.
Trading well below this group suggests Bitcoin's short- and medium-term trends remain bearish.
Bitcoin's next major move will likely hinge on whether buyers can defend recent lows and reclaim previously broken technical levels.
Last week's low near $62,006 is the immediate downside reference. A sustained break below this level could intensify selling pressure and bring the psychological $60,000 mark into view.
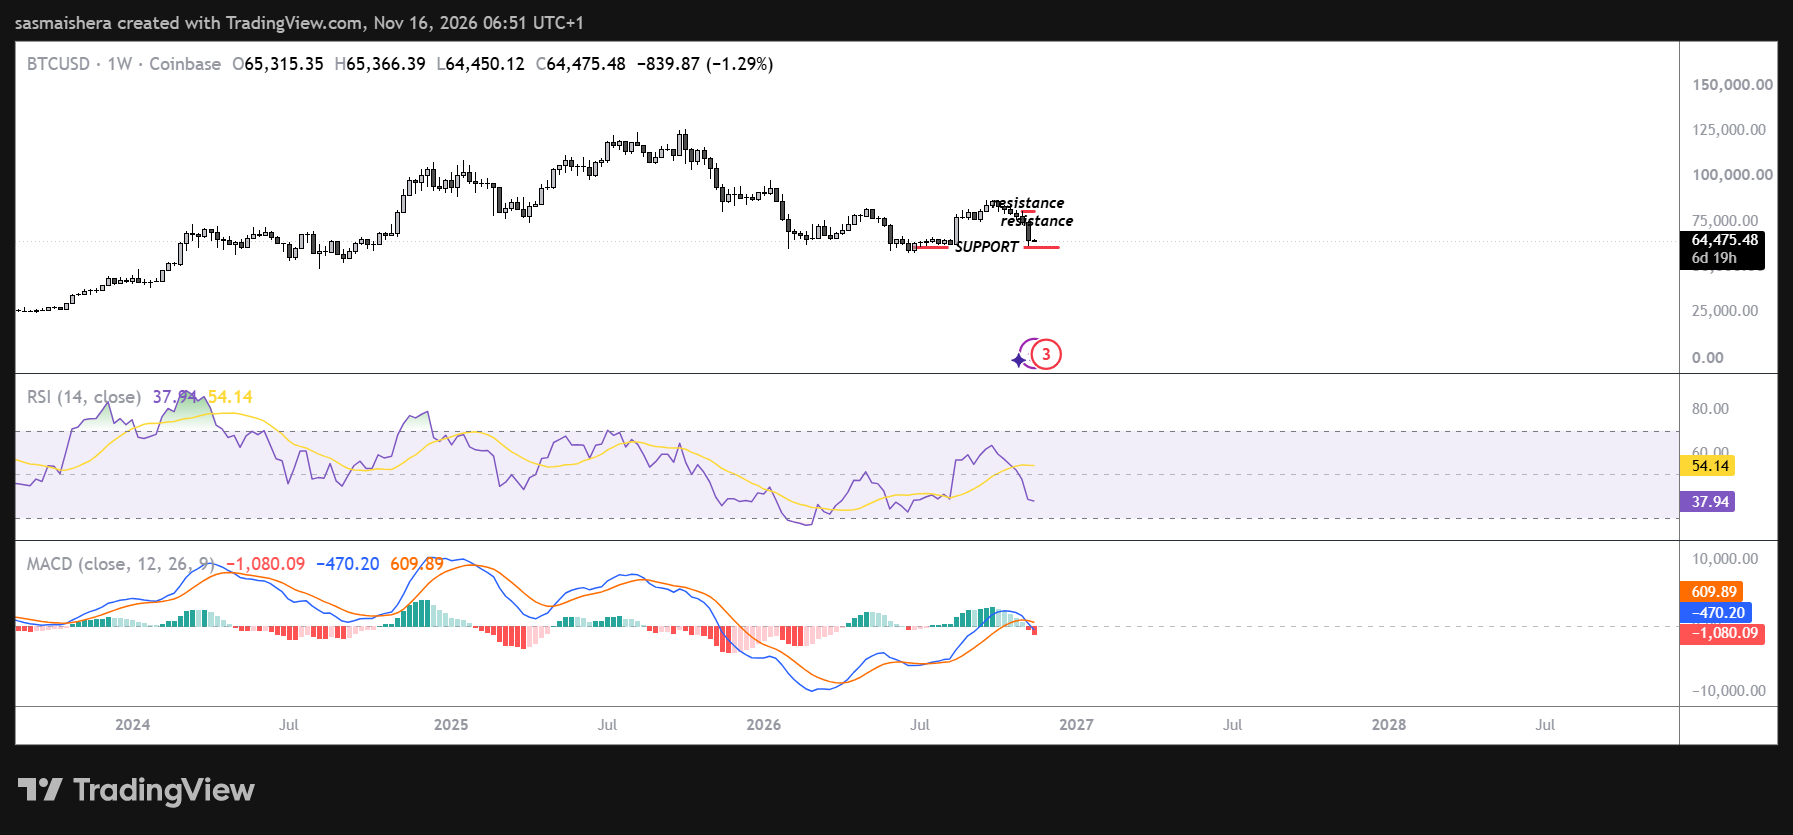
On the upside, the first key level to reclaim is the 78.6% Fibonacci retracement at $65,616. A sustained move above it could encourage buyers to target the 200-week SMA near $68,194.
Reclaiming the 200-week average would offer an early sign that Bitcoin's longer-term technical structure is improving.
However, a stronger recovery would still encounter resistance from the daily EMA cluster between $75,946 and $76,701.
A decisive break above this area would suggest bearish momentum is weakening and could open the way to a recovery toward horizontal resistance at $85,000.
AI disclosure: AI tools assisted with research and drafting of this piece. An Invezz editor reviewed the facts, sources and wording before publication. Any opinions or analysis are Invezz’s, not those of an automated system.