


The model projected median prices for this period at $170,000 for year-end 2027, $266,000 for year-end 2028, and $537,000 for year-end 2030.
At year-end 2034, the model places Bitcoin’s 5th percentile distribution (lowest) at $464,000 (6x the current price of $79,968). At its 95th percentile, the simulation places Bitcoin at $5.62 million, which is about 70x the current price.
Source: X
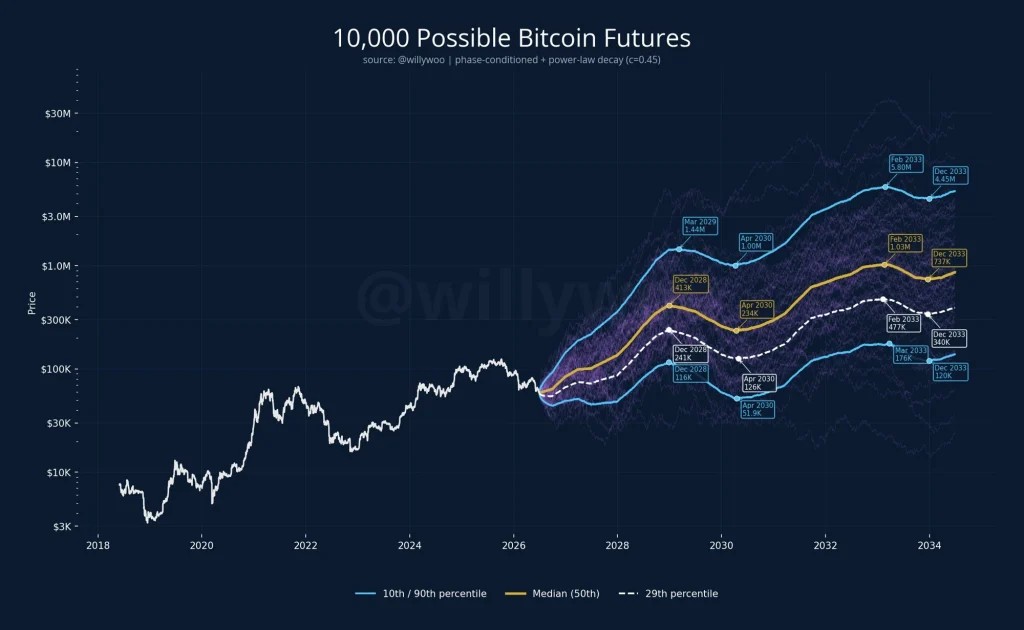
Bitcoin 2027-2034 predictions: model 2
Presented by Bitcoin analyst Willy Woo, the second case draws inspiration from the first. but is more conservative. Woo’s model runs 10,000 paths, while introducing alterations such as $BTC’s current cycle position.
Even more, the second model uses Bitcoin’s historical data rather than its ideal distribution. Woo intentionally uses the 2018-2022 period as his reference data, saying pre-2018 Bitcoin was in its “primordial era where 100x was easy.” The chosen timeline also accounts for derivatives, ETFs, and fast-moving liquidations.
He maintains the application of the Bitcoin Power Law, which shows a steady decline in Bitcoin’s annual percentage returns as the asset scales.
For year-end 2028, Woo’s model shows a price range of $116,000-$413,000. Thereafter, it is a range of $51,900-$1 million by April 2030, and $120,000-$4.45 million by year-end 2033.
He adds that prices in the 29th and 50th percentile are reasonable, with April 2030 at the lowest ($126,000), and February 2033 at the highest ($1.03M).
Source: X
What could affect $BTC’s future price?
Bitcoin’s near-term future price will likely feel the impact of Wednesday’s Fed interest rate announcement. Additional determinants are the midterm elections, and ETF trajectory. The latter have been negative in the last 5 days, with assets under management (AUM) down $1 billion in that time.
Geopolitical events, macroeconomic policy, institutional flows, and regulatory developments will likely have a strong influence on Bitcoin’s long-term price.
