
At 3:15 p.m. Eastern time, ethereum’s price stands at $4,250, supported by a market capitalization of $510.70 billion and a 24-hour trading volume of $32.21 billion. The day’s intraday range has fluctuated between $4,172.29 and $4,315.64, reflecting the heightened volatility and active participation across time frames.
Ethereum
The daily ethereum (ETH) chart reveals a strong bullish rally extending from approximately $2,500 to the recent peak at $4,336. However, the current price action shows a small red candle after this significant upward movement, suggesting possible short-term exhaustion. Key support lies between $4,000 and $4,050, marking the last consolidation area, while resistance remains near the $4,336 peak. Overall, the macro trend is intact, though the overextended nature of the rally signals caution for potential retracement.
ETH/USD 1-day chart via Deribit on Aug. 10, 2025.
On the four-hour chart, ethereum has climbed consistently since August 5 from roughly $3,545 to $4,336, followed by a phase of minor consolidation. Volume has declined post-peak, indicating reduced buying pressure, and a slight rounding top is emerging. This could be an early sign of short-term distribution before a pullback. Traders may find cleaner re-entry points on a pullback toward the $4,050–$4,100 range if accompanied by bullish confirmation, while failure to reclaim the $4,300 level could open the door to a $4,000 test.
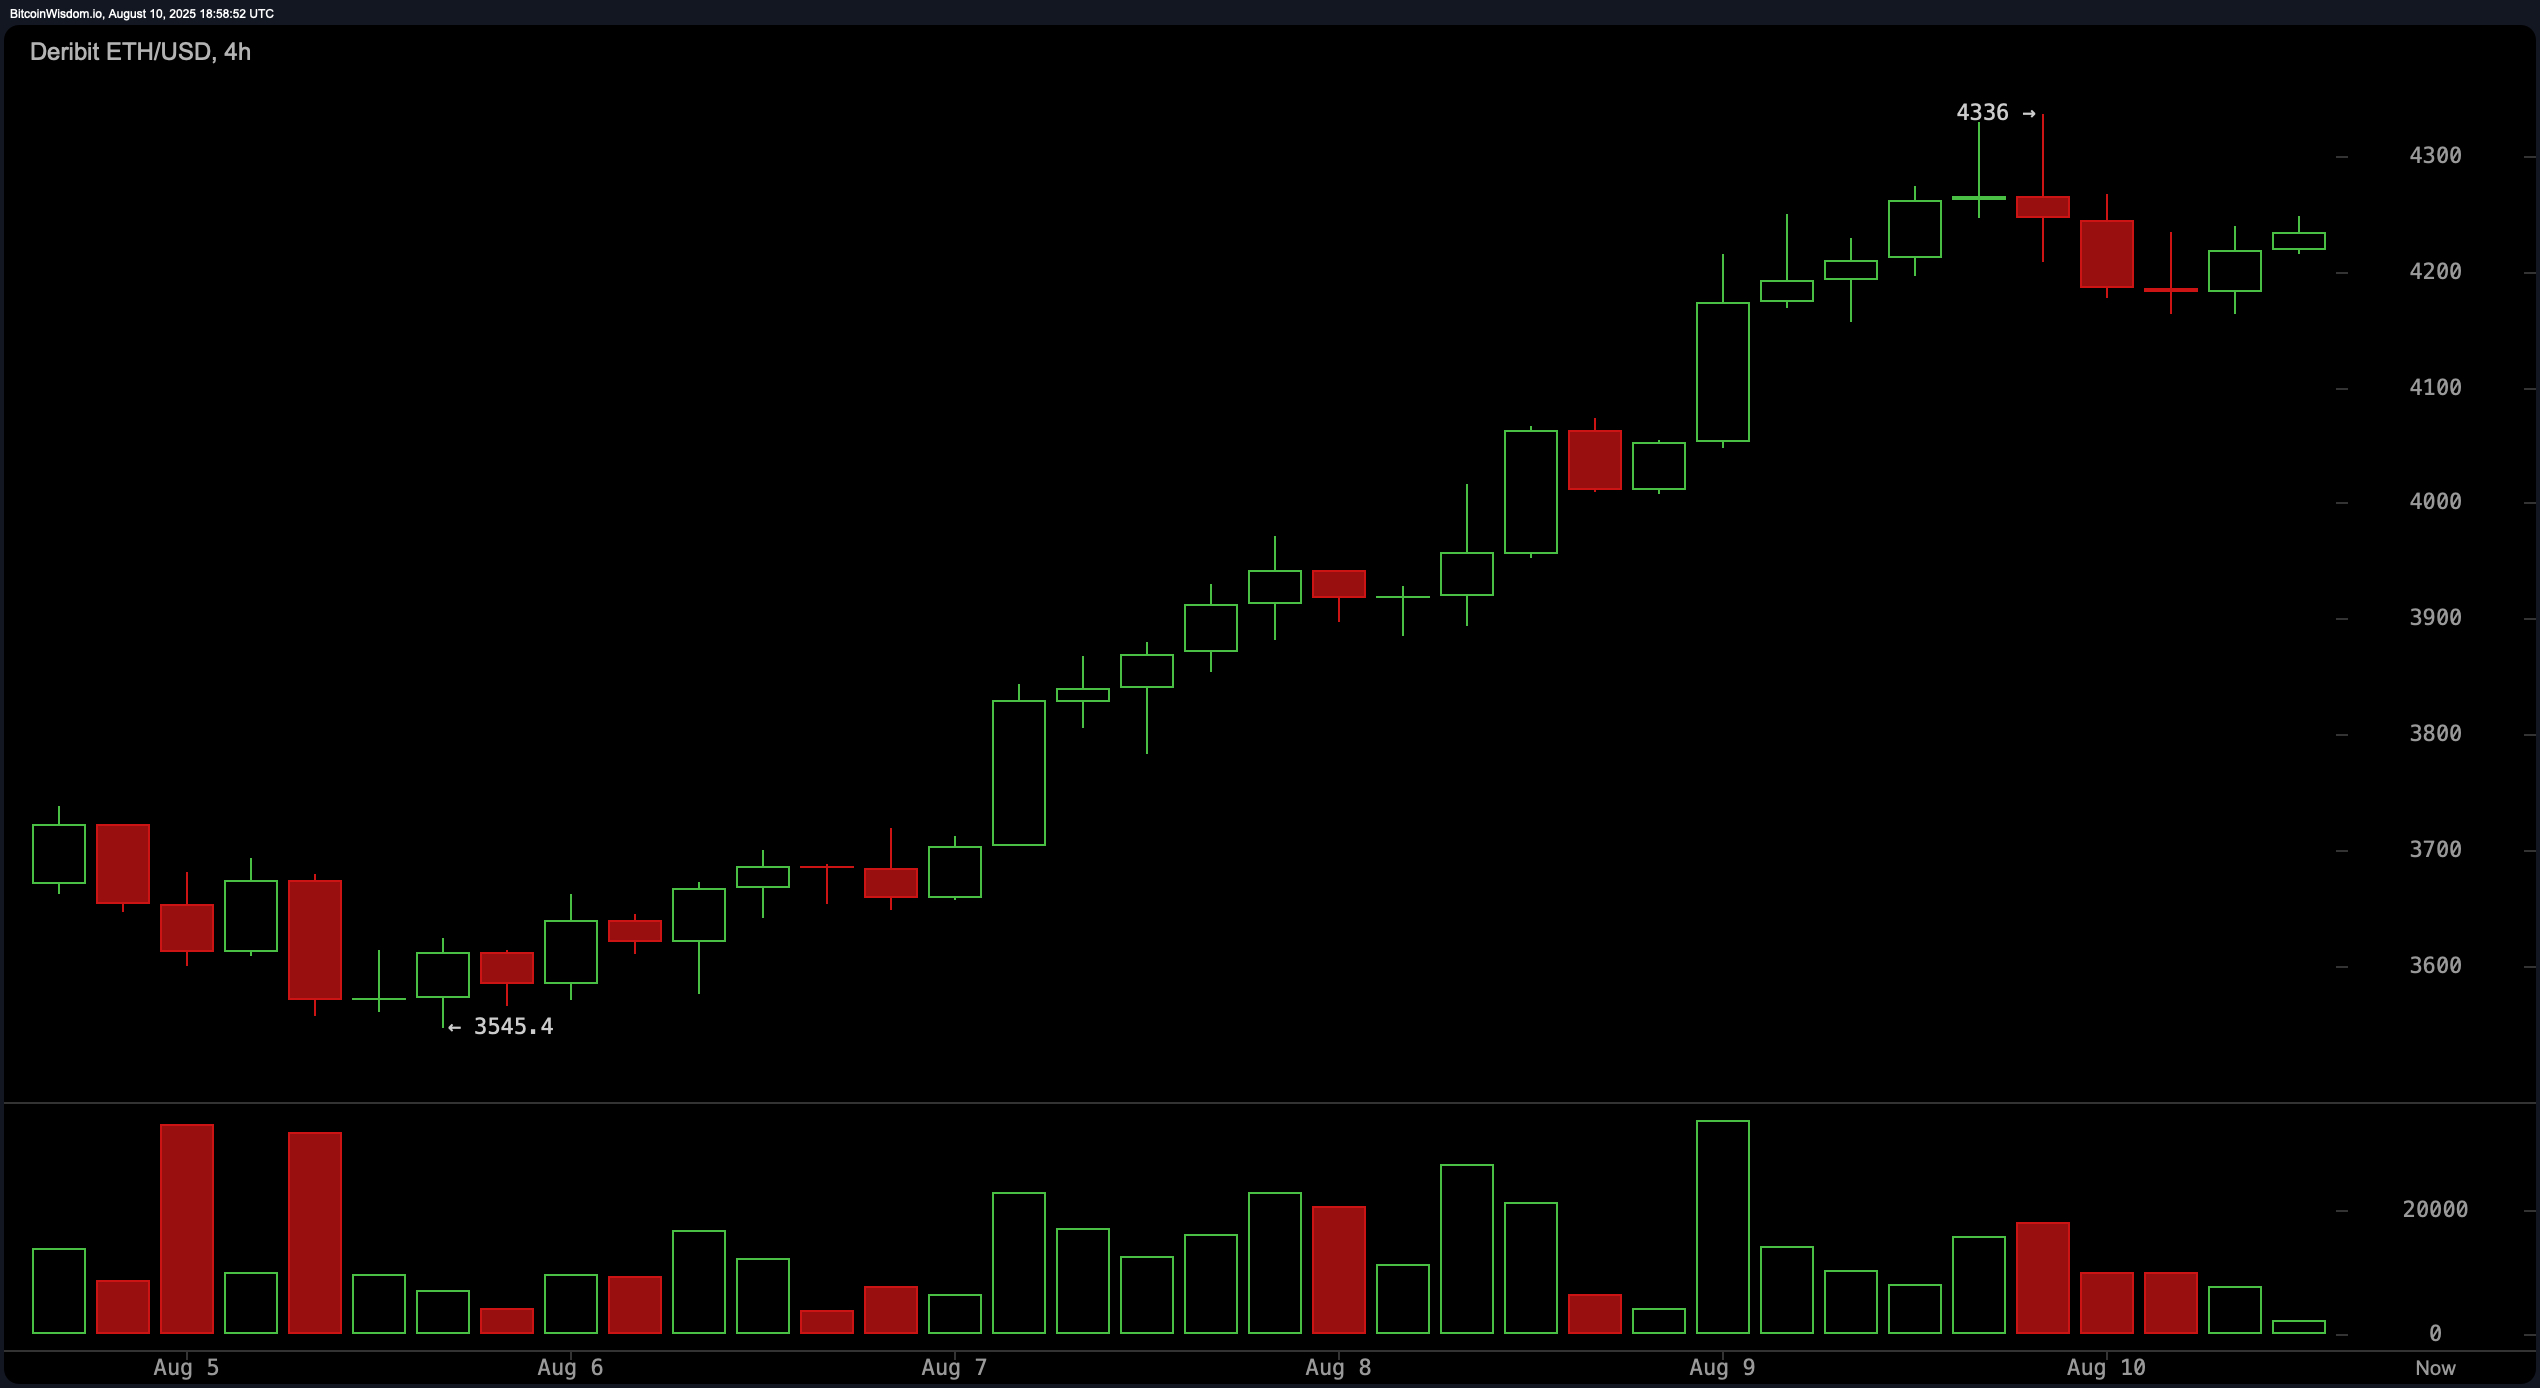
ETH/USD 4-hour chart via Deribit on Aug. 10, 2025.
The one-hour ethereum chart shows volatility after the $4,336 high, with multiple lower highs and lower lows forming. Near-term support is around $4,155, and a break of this level with volume could trigger further selling pressure. Resistance is clustered between $4,280 and $4,300, where rejections could affirm a short-term bearish bias. Scalping opportunities exist for longs near support and shorts near resistance, with profit targets in the 1–2 percent range due to choppy market conditions.
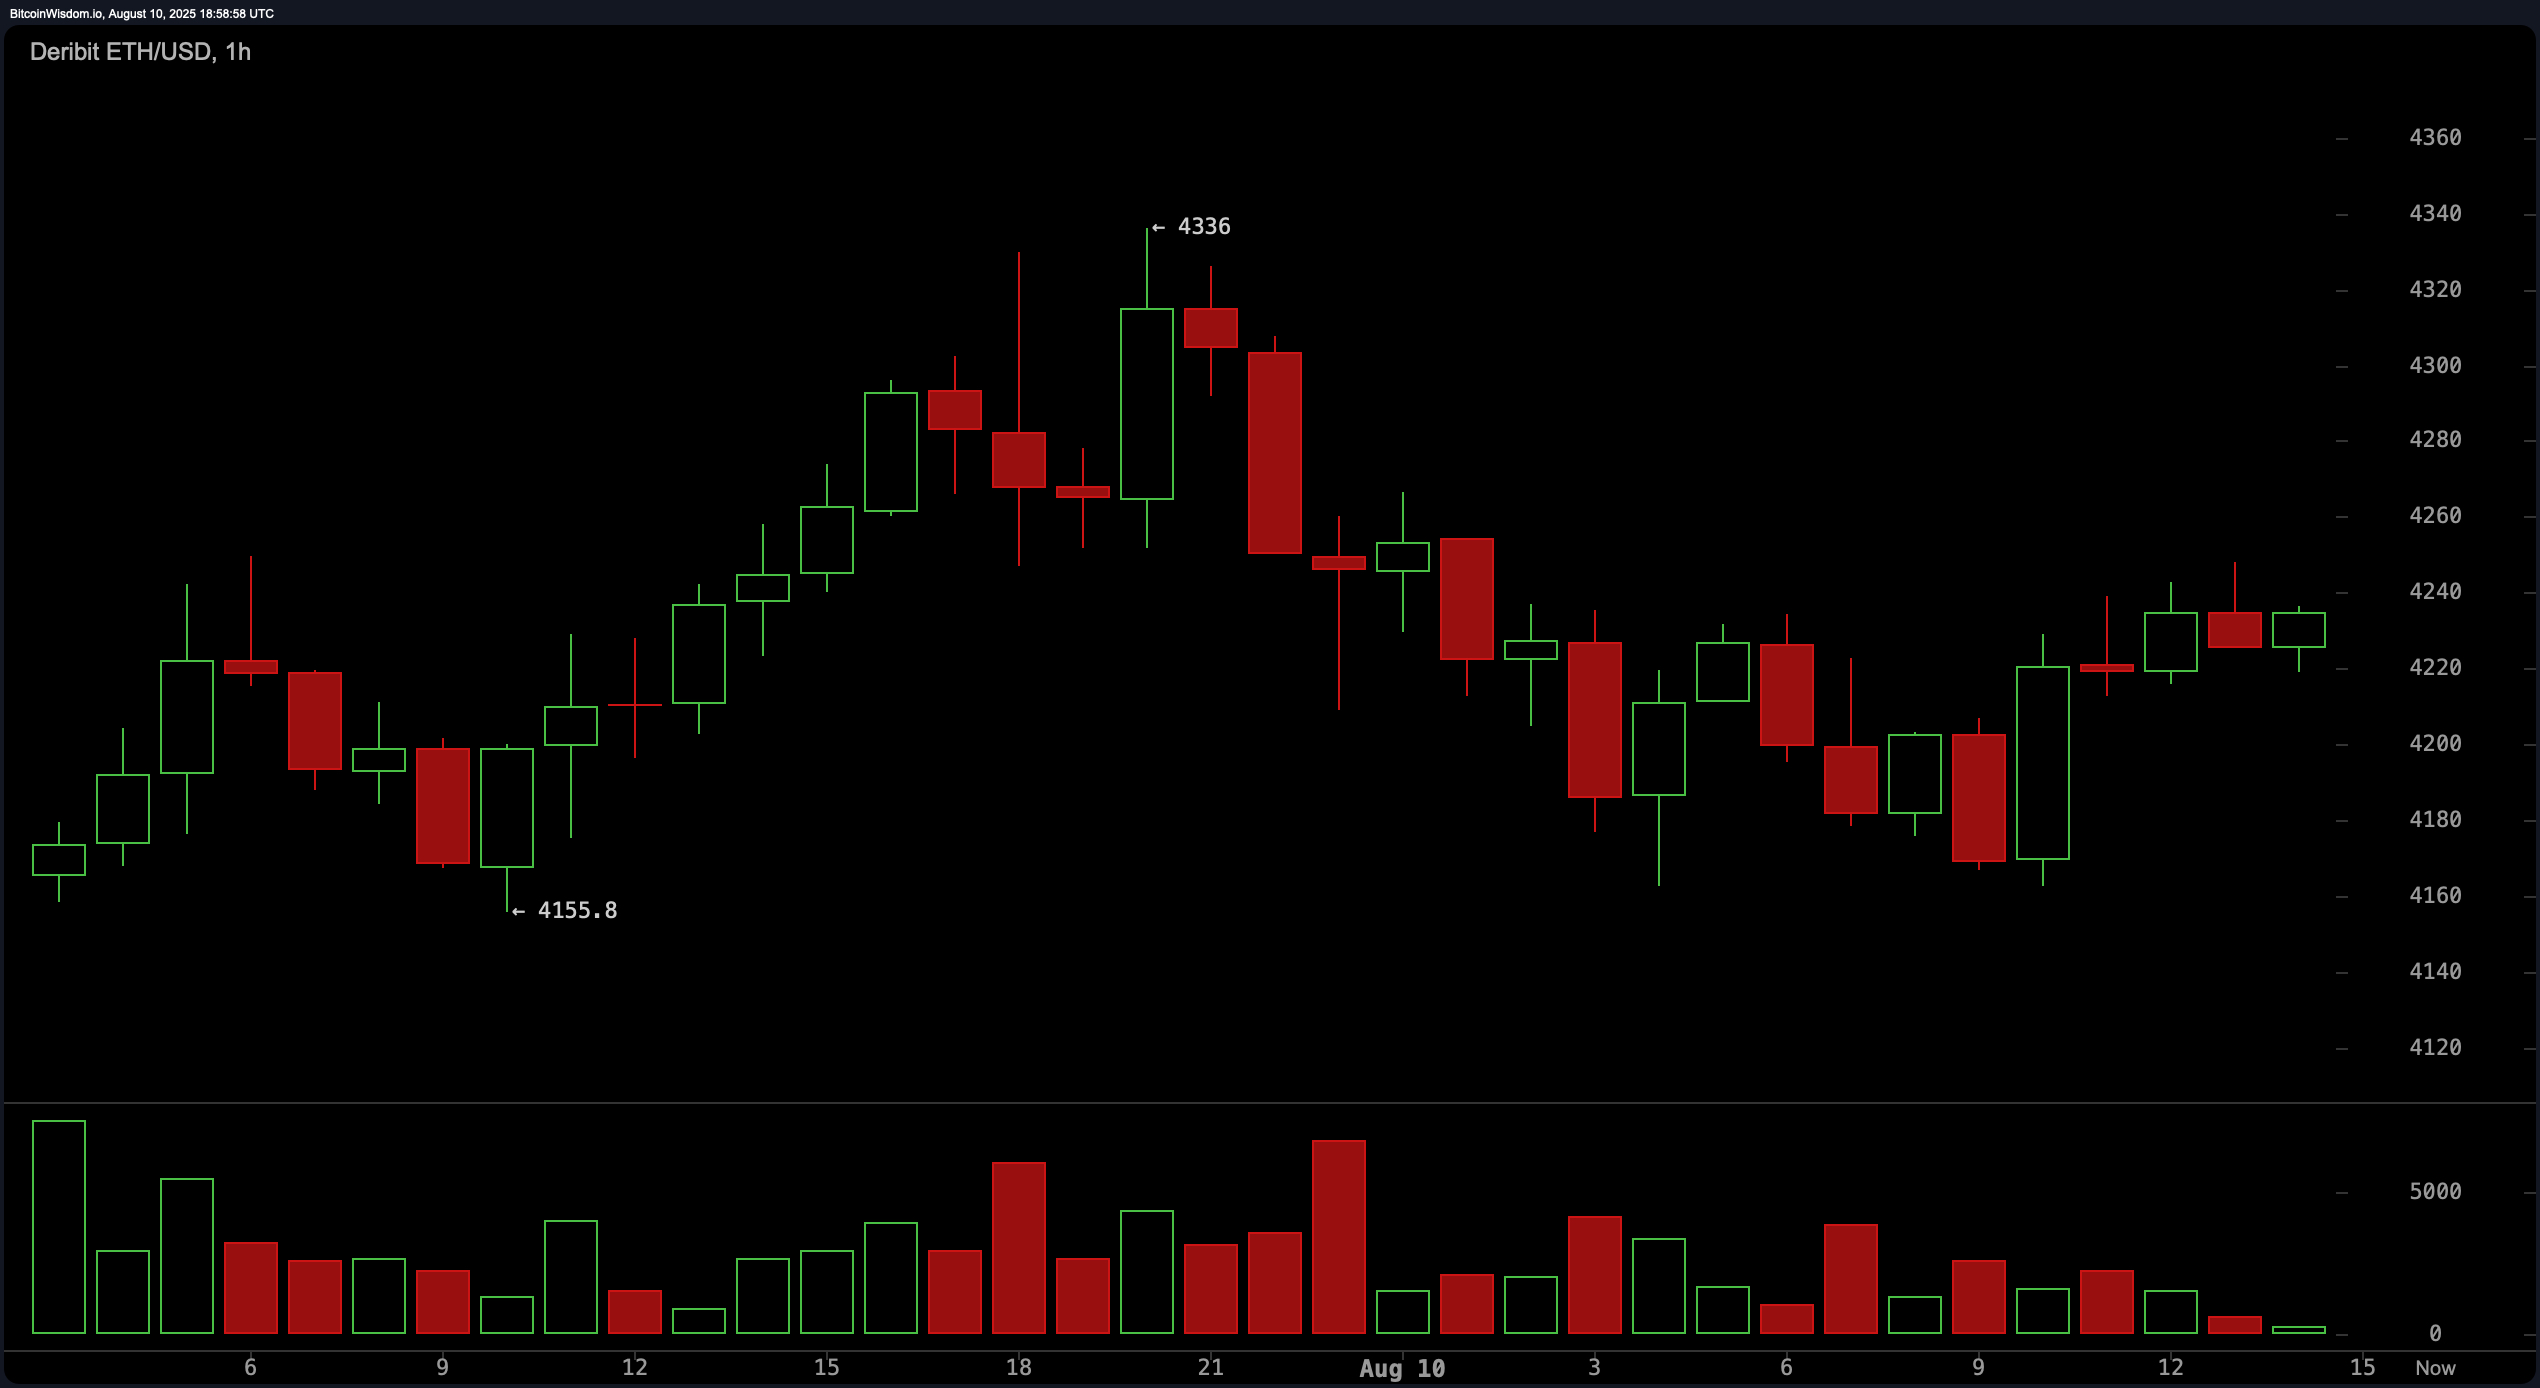
ETH/USD 1-hour chart via Deribit on Aug. 10, 2025.
Oscillator readings paint a mixed picture. The relative strength index (RSI) at 71.8 signals overbought conditions with a sell bias, while the stochastic at 91.6 remains neutral. The commodity channel index (CCI) at 222.0 also indicates a sell, yet momentum at 533.9 and the moving average convergence divergence (MACD) level at 221.5 both signal buy conditions. The average directional index (ADX) at 41.3 and the awesome oscillator at 452.3 hold neutral stances, suggesting that while upward momentum remains, it is not without resistance.
Moving averages (MAs) reinforce ether’s bullish medium-term structure. All key exponential moving averages (EMAs) and simple moving averages (SMAs) from the 10-period to the 200-period levels are in buy territory, with the exponential moving average (10) at $3,908.7 and the simple moving average (200) at $2,520.3 providing strong trend confirmation. This alignment shows that despite near-term volatility, ethereum’s broader trend remains upward, with critical support levels likely to attract buyers if tested.
Ethereum Derivatives Market Action
Ethereum futures markets are reflecting record-breaking participation, with total open interest (OI) across exchanges hitting approximately $58.57 billion, or 13.83 million ETH. The largest share is held by Binance at 20.1% of total open interest, followed by CME at 12.46% and Bybit at 9.48%. Open interest changes over the past 24 hours show marginal upward momentum on most platforms, signaling sustained trader commitment despite the recent choppiness in the weekend spot price action. This strong OI mirrors the broader market’s conviction that ethereum will remain a high-volatility, high-liquidity asset in the near term.
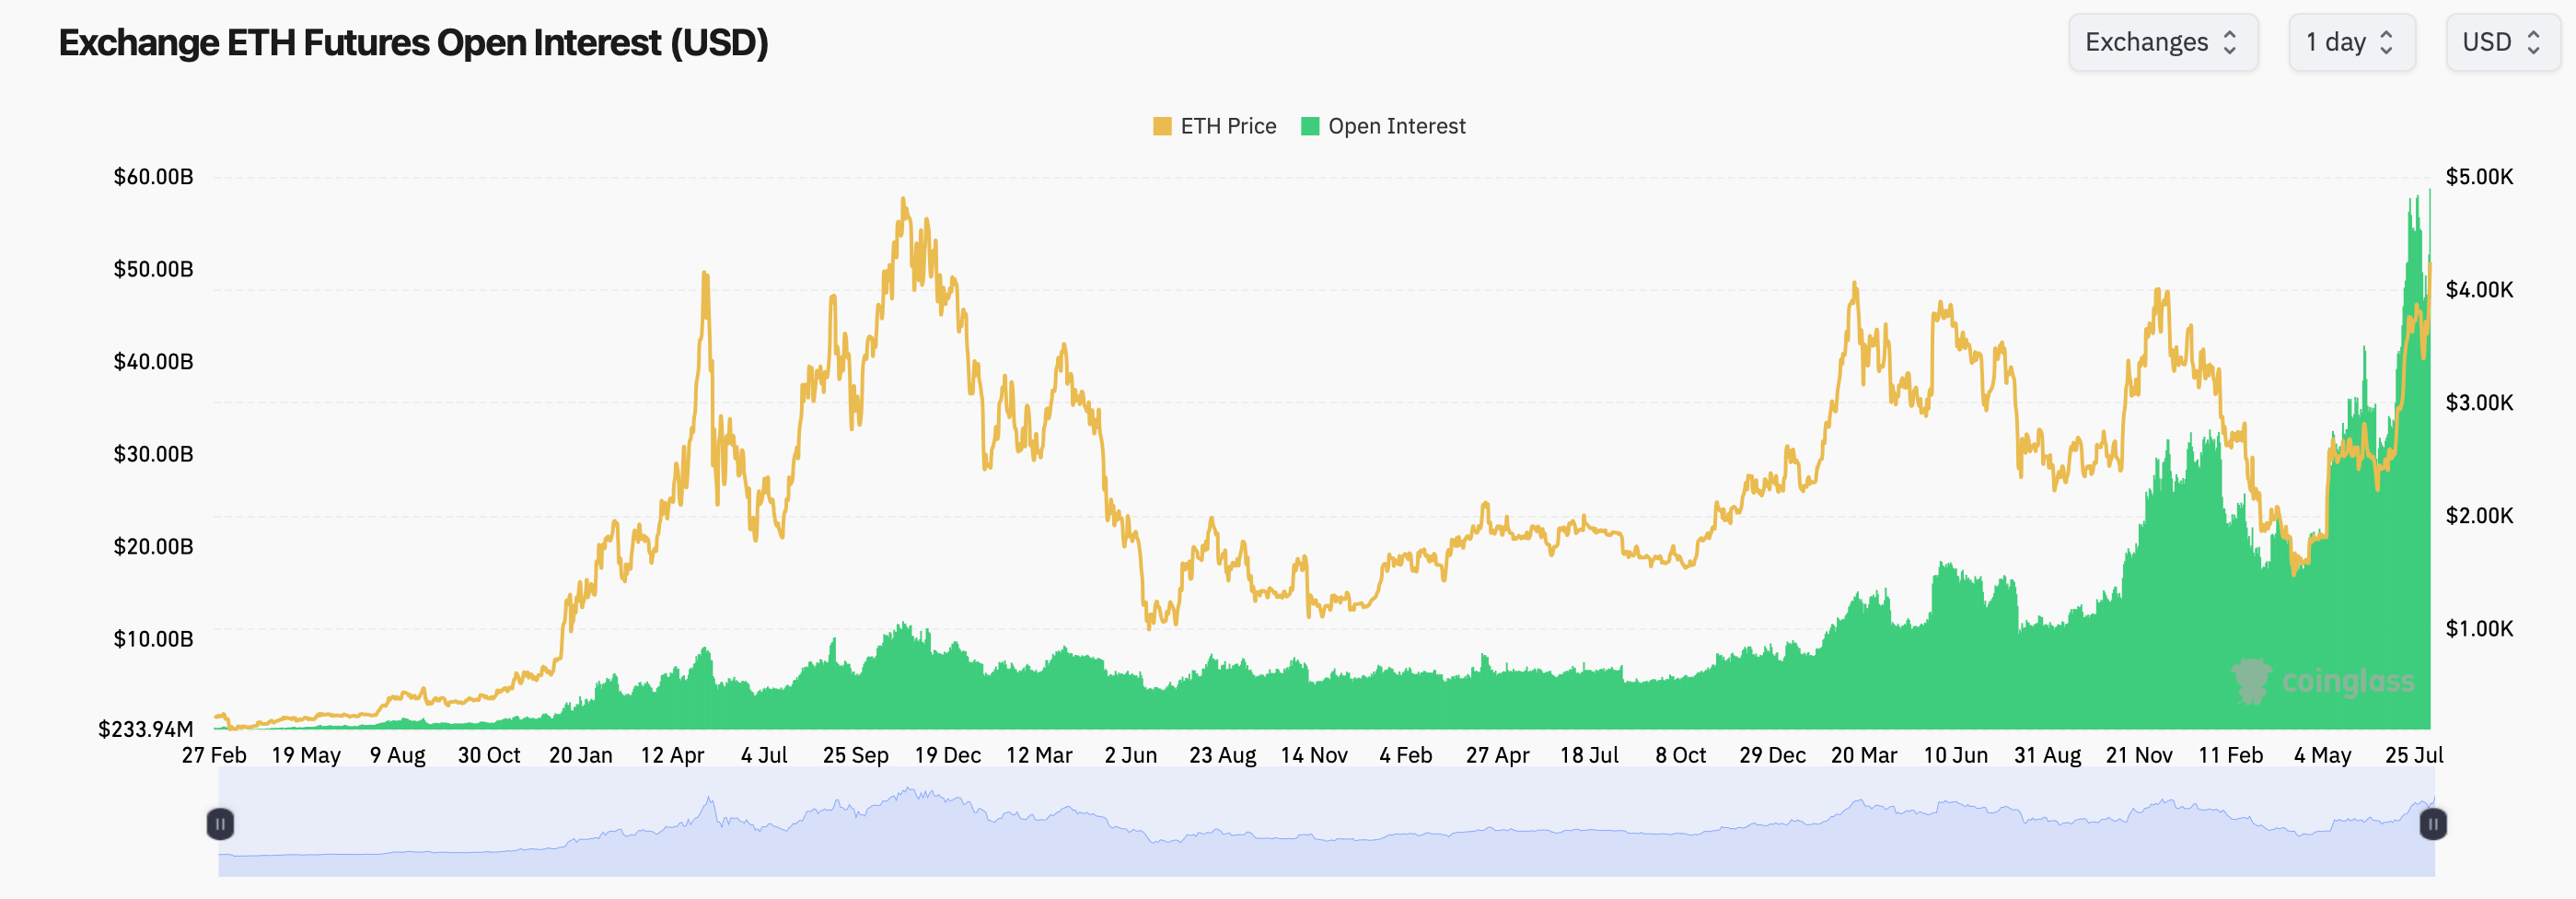
Ethereum futures open interest (OI) according to coinglass.com stats.
Options data adds another layer to ether’s bullish tilt. Calls dominate with 67.71% of the total open interest versus 32.29% in puts, representing 2.3 million ETH in call positions. Notably, contracts for December 2025 with strike prices at $6,000 and $4,000 lead OI figures, hinting at longer-term bullish expectations. In the past 24 hours, call volume also outpaced puts at 61.04% versus 38.96%, led by September 2025 $4,500 call options. This skew toward upside exposure suggests that many traders are positioning for a breakout beyond current resistance levels, aligning with the sustained upward slope in moving averages.
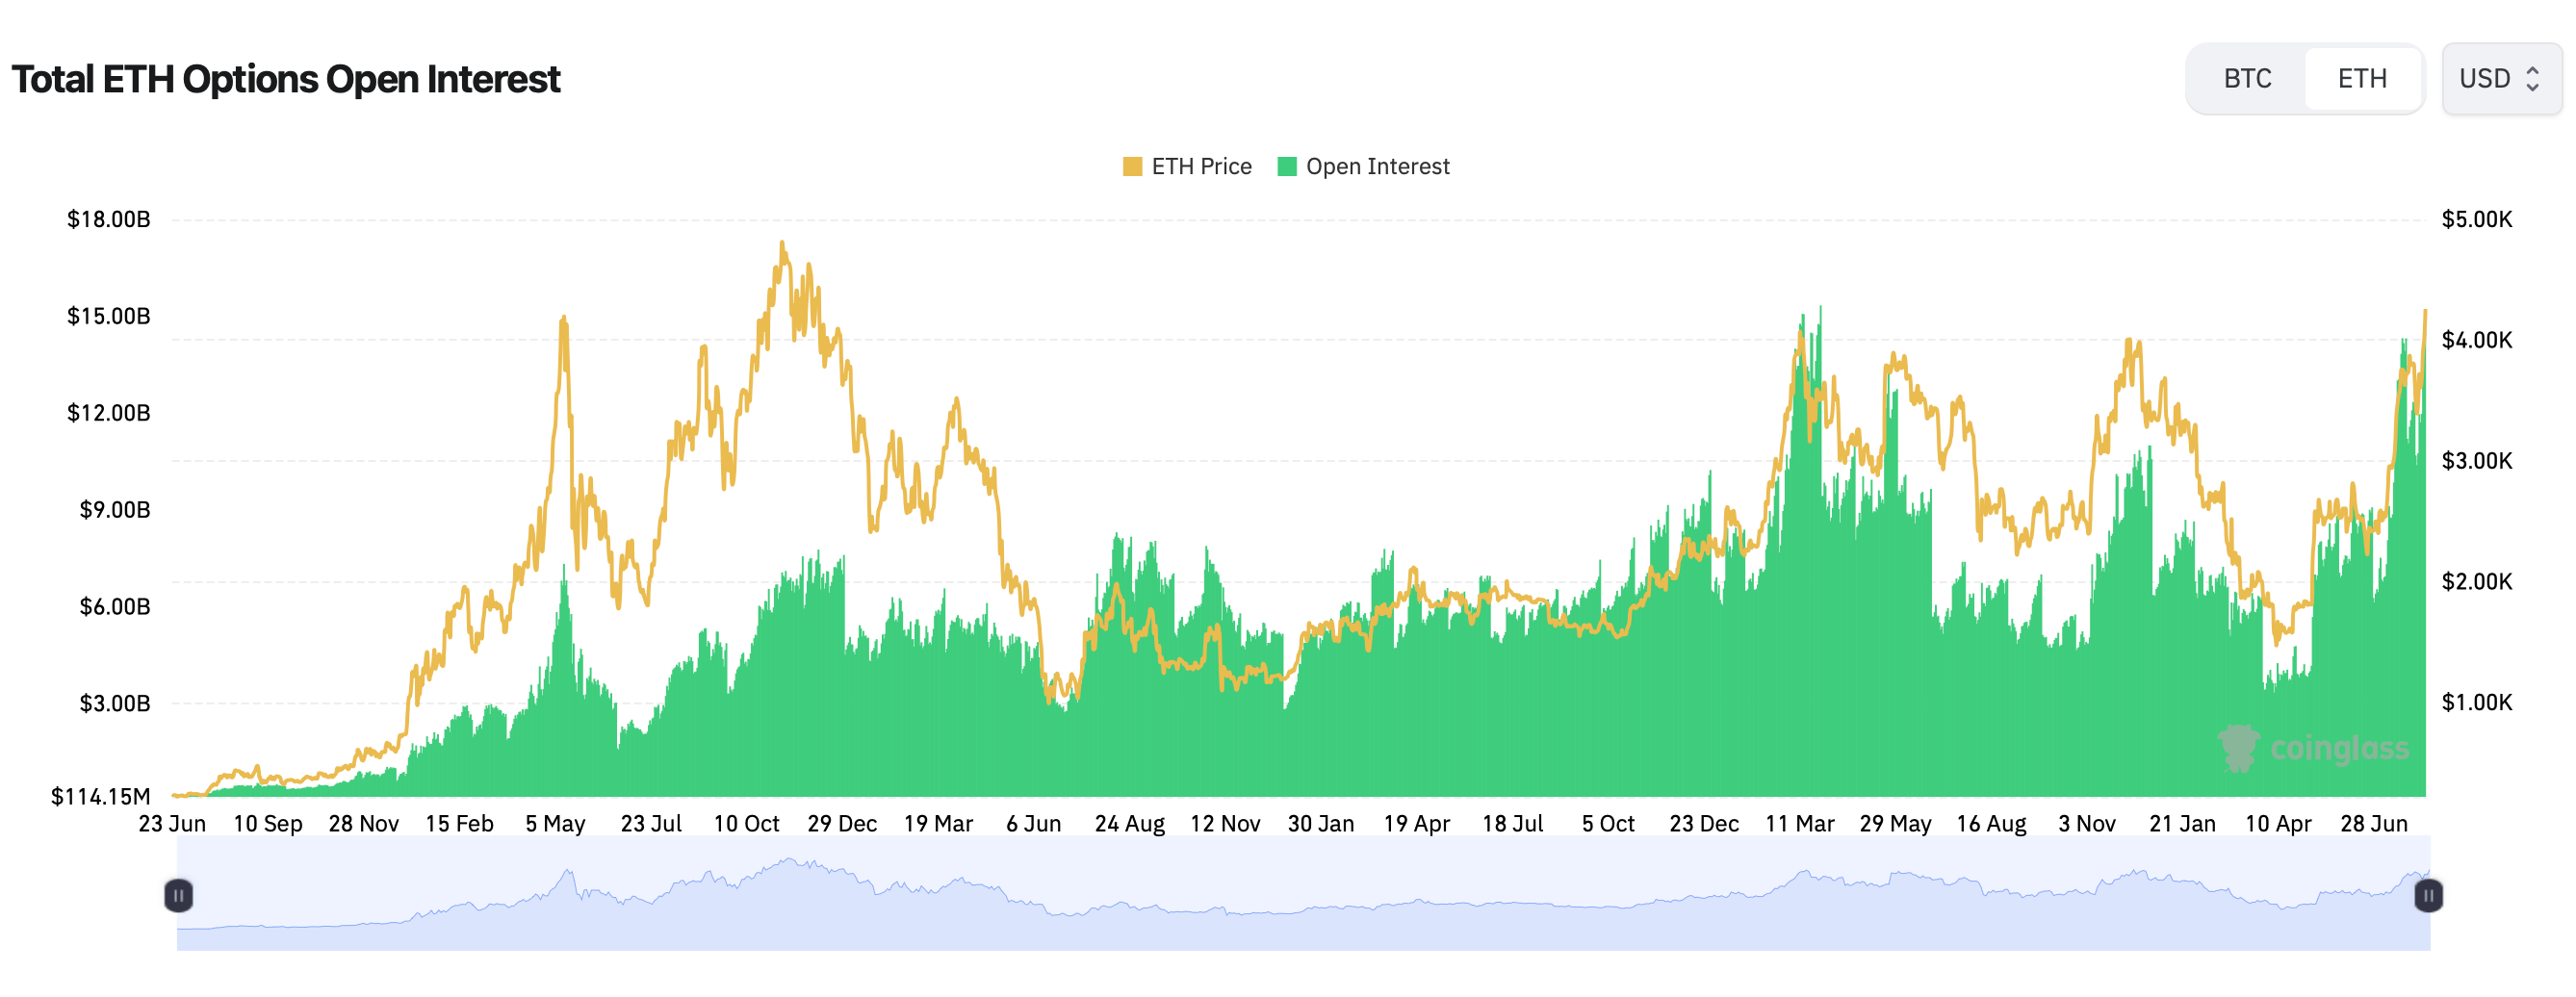
Ethereum options open interest (OI) according to coinglass.com stats.
Liquidations over the past day have been substantial, totaling $328.71 million across the crypto market, with ethereum accounting for the largest share at $116.79 million. The split between long and short liquidations is nearly balanced at $169.39 million and $159.32 million, respectively, revealing an intense two-way battle between bulls and bears.
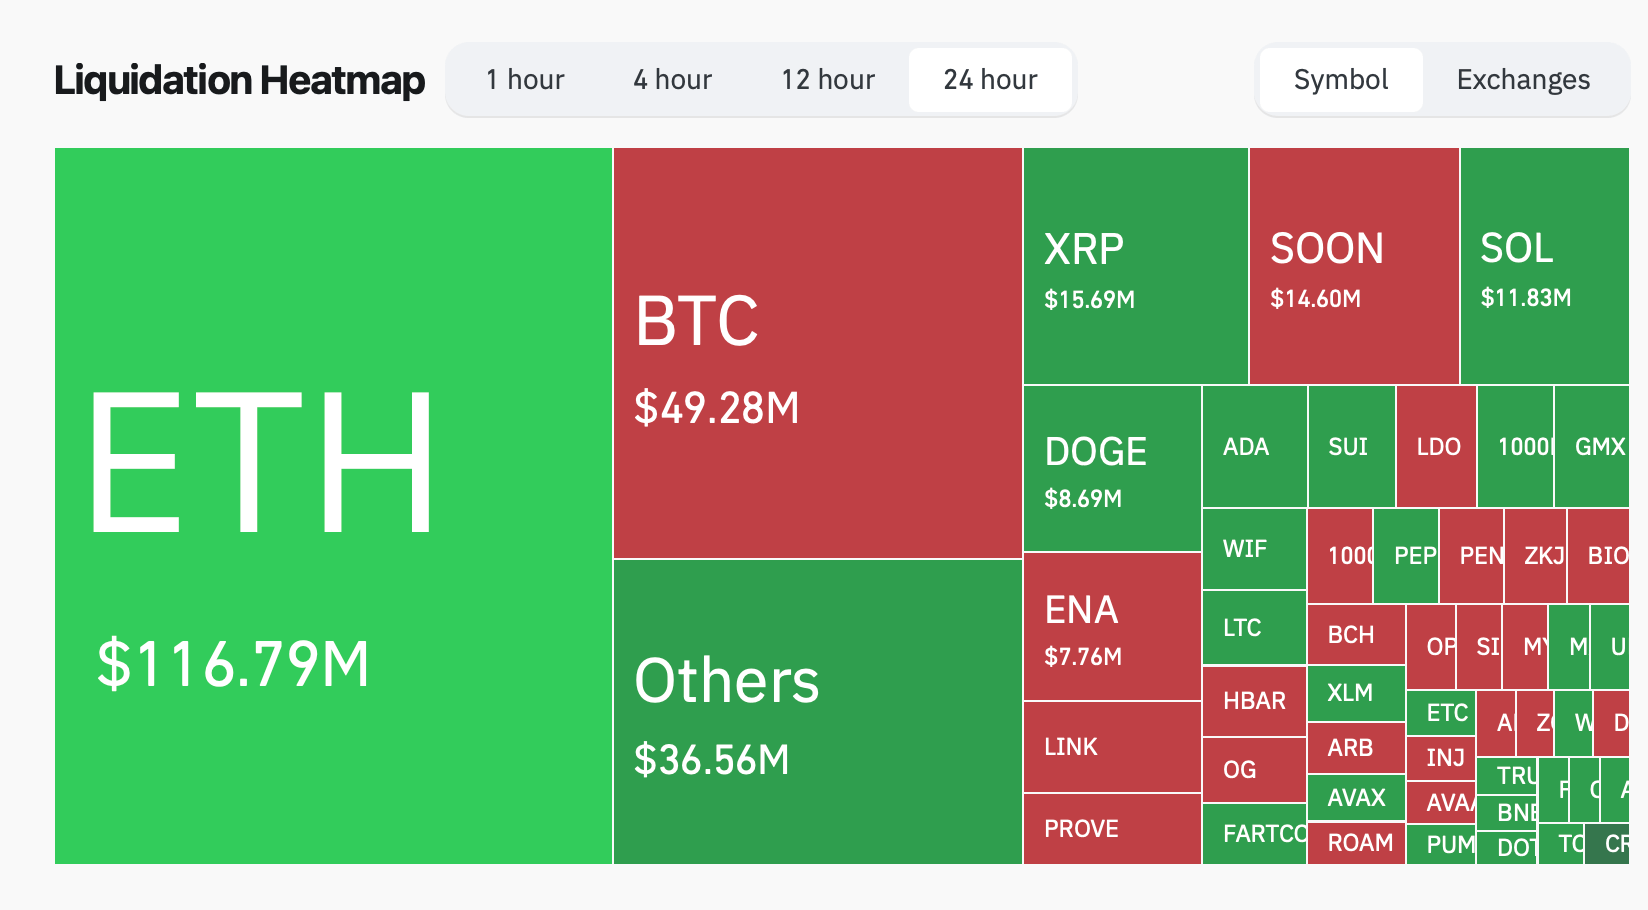
Ethereum led the day in terms of liquidations according to figures collected by coinglass.com.
Bull Verdict:
Ethereum’s futures and options structure, with a dominant 67.71% call positioning and record-high open interest nearing $59 billion, supports a continued upside bias. All major moving averages remain in buy territory, and strong institutional participation through platforms like CME and Binance points to confidence in further price appreciation. A breakout above $4,300 could open the path toward retesting the $4,336 peak and potentially aiming for $4,500 and beyond.
Bear Verdict:
Despite the bullish longer-term structure, elevated relative strength index (RSI) readings and heavy liquidation totals of $328.71 million in the last 24 hours hint at a market stretched thin. Declining volume after the recent high, coupled with resistance near $4,300 and a rounding top on the 4-hour chart, could lead to a pullback toward the $4,050–$4,000 support zone. A break below $4,000 would likely trigger another liquidation cascade, shifting momentum firmly in favor of sellers.