
Capital movement across blockchain networks is always a key sign for judging investor confidence and network activity. Looking at the last week, Base blockchain came out on top for positive net flow, doing better than all other chains.
Solana was right behind, taking second place even with ongoing worries about its network stability.
Base and Solana Dominate Blockchain Net Inflows
Bitcoin, Ethereum, and Arbitrum also saw positive net flows, though not as much. On the other hand, Polygon PoS, Sui, and StarkNet had minor inflows, while Avalanche C-Chain and OP Mainnet experienced significant outflows.
Notably, OP Mainnet had the biggest capital outflow, showing weaker investor sentiment towards that chain.
BASE is the only chain doing better than $SOL.
Amazing considering the sentiment around $SOL. pic.twitter.com/fuC1mthfug
— Altcoin Buzz (@Altcoinbuzzio) February 18, 2025
Base Overtakes Solana in Capital Inflows
Even with market uncertainty, Base became the leader in net capital inflows. This is quite notable, especially given Solana’s lead position in recent times
Market sentiment toward Solana has been mixed, mostly because of past outages and centralization talk. However, its ability to keep attracting strong inflows suggests confidence in its long-term potential. The recent flow of money highlights investor optimism even when prices are moving up and down in the short term.
Solana Price Analysis: Key Levels to Watch
Solana’s price has gone down of late, currently trading at $172.16 after a 6.45% drop over the past 24 hours.
The price initially went up to an intraday high of $184.03 before hitting resistance, causing a downward trend. A strong resistance level appeared around $184-$186, where selling pressure increased, leading to a pullback.
Key support levels are forming at $172, $170, and the $165-$168 range. If the price doesn’t stay above $172, further declines could push it toward $170. A stronger breakdown may lead to a retest of the $165-$168 support zone, where buyers could come back into the market.
Source: CoinMarketCap
Market sentiment remains cautious, with trading volume increasing by 61.85%, showing more activity mainly from sellers.
Solana’s market capitalization also declined by 6.45%, indicating reduced investor confidence. However, a recovery above $176 could change momentum, potentially pushing the price back toward the $180 range.
Related: Solana Meme Coins Plummet By 91%, But Analysts See Signs of Massive Rebound
Technical Indicators Point to Caution
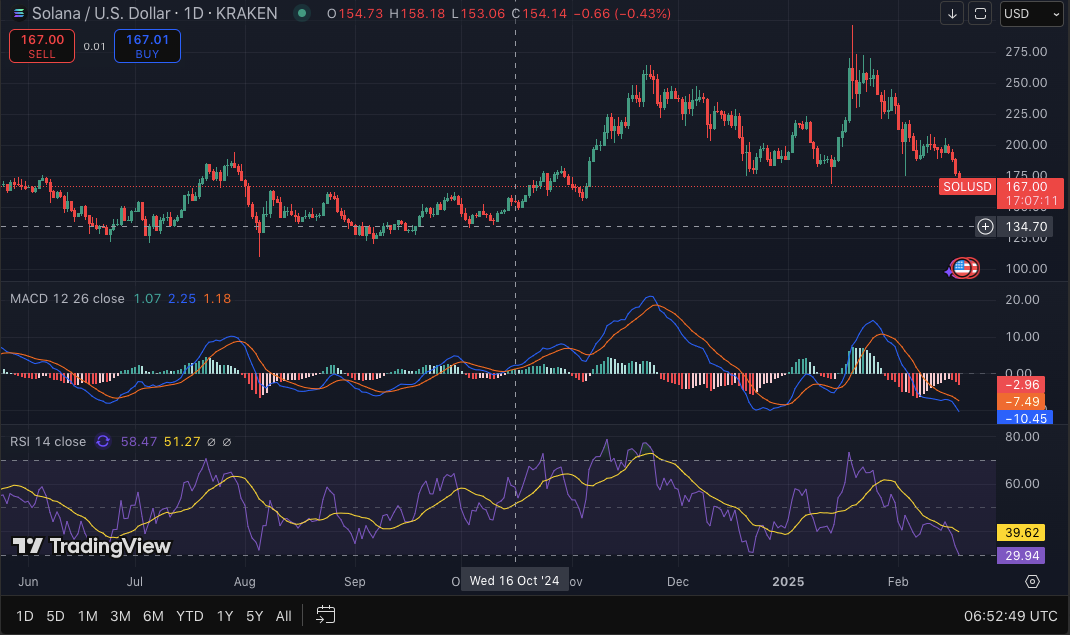
SOL/USD daily price chart. Source: TradingView
The Relative Strength Index (RSI) currently stands at 31.27, nearing oversold territory. This suggests that a potential bounce could occur if buying pressure strengthens. However, the RSI’s downward trajectory indicates that bearish sentiment remains dominant.
Additionally, the Moving Average Convergence Divergence (MACD) shows a bearish crossover. The MACD line sits at -2.69, below the signal line at -10.11, confirming downside pressure. Negative histogram bars further reinforce the prevailing bearish momentum.
February 2025 Price Outlook for Solana
Coincodex Market projections for February 2025 suggest a potential price increase of up to 10.51%, bringing Solana’s average price to about $189.50.
Related: Despite Tough Year, Solana Shows Growth In Some Key Areas
Predicted price fluctuations point to a range between $177.26 and $195.47. If these predictions are correct, Solana could provide a short-term return of around 13.99% from current levels.
Disclaimer: The information presented in this article is for informational and educational purposes only. The article does not constitute financial advice or advice of any kind. Coin Edition is not responsible for any losses incurred as a result of the utilization of content, products, or services mentioned. Readers are advised to exercise caution before taking any action related to the company.