

Markets are navigating a fearful risk-off phase, and the Ethereum price today sits at the center of this tension between recent selling and a fragile intraday recovery.
loading=”lazy” />
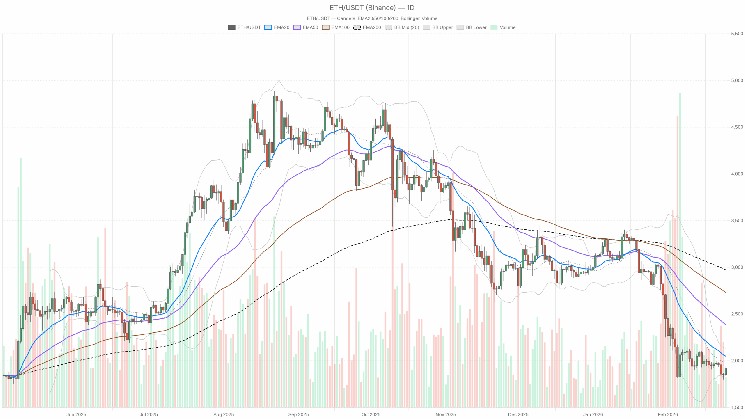
$ETH/$USDT — daily chart with candlesticks, EMA20/EMA50 and volume.
Daily Timeframe (D1) – Main Bias: Bearish
Trend Structure: EMAs
Price vs EMAs (D1)
– Close: $1,923.80
– 20-day EMA: $2,048.77
– 50-day EMA: $2,386.34
– 200-day EMA: $2,973.01
– Regime flag: bearish
Ethereum is trading below the 20, 50, and 200-day EMAs, and the stack is inverted (price < 20 < 50 < 200). That is a textbook downtrend structure. It tells us that not only the short-term, but also the medium and long-term crowds have been selling rallies for a while. Moreover, bounces toward the 20-day EMA around $2,050 currently look like opportunities for sellers rather than signs of a healthy uptrend.
Momentum: RSI (D1)
– RSI 14 (daily): 36.16
Daily RSI is sitting in the bearish but not yet oversold area. That means selling pressure has been dominant, but the market is not fully washed out. There is room for price to bounce a bit without changing the bigger picture, and also room for another leg down before we hit classic oversold extremes. In other words, momentum is weak, but not capitulative.
Momentum & Trend Confirmation: MACD (D1)
– MACD line: -165.82
– Signal line: -191.23
– Histogram: +25.41
The daily MACD is still deep in negative territory, confirming a broader downtrend, but the histogram has turned positive. That tells us the downside momentum is losing strength: the selloff is slowing, and we are in a phase of bearish trend with a countertrend bounce. This aligns with what price is doing intraday, attempting to claw back some ground from a clearly damaged structure.
Volatility & Mean Reversion: Bollinger Bands (D1)
– Middle band (20 SMA): $1,989.29
– Upper band: $2,132.48
– Lower band: $1,846.10
– Close: $1,923.80
Price is sitting below the middle band, leaning closer to the lower half of the volatility envelope. The recent selloff pushed $ETH toward the lower band, and now price is trying to mean-revert upward toward the midline around $1,990. As long as $ETH trades under that mid-band, the Bollinger setup supports a rallies are vulnerable stance rather than a trend reversal story.
Volatility & Risk: ATR (D1)
– ATR 14 (daily): $91.70
Daily volatility is elevated but not extreme. An ATR around $92 means daily swings of 4–5% are entirely normal in the current environment. That is wide enough that stops placed too tight near intraday levels risk getting flushed, while still far below panic conditions you see during a full meltdown.
Key Daily Levels: Pivots (D1)
– Pivot point (PP): $1,905.13
– First resistance (R1): $1,963.53
– First support (S1): $1,865.41
$ETH is trading just above the daily pivot. That tells you the market has shifted from heavy selling to a more balanced stance on the day, with near-term upside room toward $1,960–$1,965. However, losing the pivot and then $1,865 would show that sellers are back in control and that this bounce is failing.
Hourly Timeframe (H1) – Short-Term Recovery, But Under the 200 EMA
Trend Structure: EMAs (H1)
– Close: $1,923.73
– 20-EMA: $1,888.62
– 50-EMA: $1,882.42
– 200-EMA: $1,925.08
– Regime flag: neutral
On the hourly chart, price is trading above the 20 and 50 EMA but is right under the 200 EMA. Short-term participants have flipped to a bullish micro-trend, but the broader intraday trend cap is still there at the 200 EMA. The hourly regime marked as neutral is exactly that: a recovery wave running into a longer intraday ceiling.
Momentum: RSI (H1)
– RSI 14 (hourly): 66.6
Hourly RSI is pushing into the upper range, close to overbought. The latest leg is strong but stretched. That type of reading near the 200 EMA tends to attract profit-taking or at least a pause. Bulls have momentum on this timeframe, yet they are approaching a zone where continuation requires fresh buyers, not just short covering.
Momentum & Trend Confirmation: MACD (H1)
– MACD line: +15.77
– Signal line: +11.57
– Histogram: +4.19
Hourly MACD is positive and widening. That fits the story of a firm intraday bounce with upside pressure still present. Together with RSI, it shows buyers are in control of the short-term tape, but because this is happening right below the 200 EMA, the move still looks like a test of resistance within a larger downtrend, not a confirmed trend change.
Volatility & Mean Reversion: Bollinger Bands (H1)
– Middle band: $1,883.93
– Upper band: $1,938.94
– Lower band: $1,828.92
– Close: $1,923.73
Price is trading close to the upper hourly Bollinger band. That often marks the later stage of a short-term leg, where continuation is possible but risk of a pullback toward the midline grows. Intraday, $ETH has moved from the lower band to the top in a fairly straight line; it is a strong move, but it is also getting hot.
Volatility: ATR (H1)
– ATR 14 (hourly): $20.77
Hourly ATR above $20 shows decent intraday range. That is enough volatility for tactical trading within the day, but not chaos. You should still expect $15–$25 swings inside a session to be routine.
Key Hourly Levels: Pivots (H1)
– Pivot point (PP): $1,918.97
– First resistance (R1): $1,930.18
– First support (S1): $1,912.52
$ETH is hovering just above the hourly pivot and below R1 at roughly $1,930. The market is treating the low $1,930s as immediate resistance. A clean push and hold over R1 would keep the short-term recovery intact, while a drop back below the pivot and then S1 would show the bounce is losing steam.
15-Minute Timeframe (M15) – Execution Context Only
Trend Structure: EMAs (M15)
– Close: $1,923.74
– 20-EMA: $1,909.62
– 50-EMA: $1,896.99
– 200-EMA: $1,881.84
– Regime flag: bullish
On the 15-minute chart, price is well above the 20, 50, and 200 EMAs, with a bullish intraday stack. This is a short-term uptrend inside the hourly recovery, but it is still nested within the bearish daily structure. Shorter-term longs are in control for now, but they are trading against the bigger trend.
Momentum: RSI (M15)
– RSI 14 (15m): 67.07
RSI on the 15-minute chart is elevated, consistent with a strong, possibly late-stage micro-rally. It is not a reliable directional signal on its own, but combined with price near higher-timeframe resistance, it argues for more two-sided action ahead rather than a straight-line move.
Momentum & Trend: MACD (M15)
– MACD line: +6.66
– Signal line: +5.59
– Histogram: +1.07
The 15-minute MACD is positive with a modest histogram, confirming ongoing but maturing upside momentum. Bulls are still pressing, but the impulse is no longer fresh; it is more a continuation of the existing push.
Volatility & Mean Reversion: Bollinger Bands (M15)
– Middle band: $1,906.09
– Upper band: $1,929.76
– Lower band: $1,882.41
– Close: $1,923.74
On the 15-minute timeframe, price is just under the upper Bollinger band. That lines up with the idea of a short-term move that is extended and prone to consolidation or a pullback toward the midline around $1,906 if higher-timeframe sellers step in.
Intraday Noise: ATR & Pivots (M15)
– ATR 14 (15m): $7.81
– Pivot point (PP): $1,922.83
– First resistance (R1): $1,926.33
– First support (S1): $1,920.23
With a 15-minute ATR around $8, micro-swings of several dollars up or down are noise. Price is sitting on top of the 15-minute pivot and trading between S1 and R1, a sign of a balanced but elevated intraday zone where small pullbacks and pops are common.
Cross-Timeframe Picture & Market Context
Across timeframes, the message is mixed but not confusing:
– Daily: Bearish trend, weak but stabilizing momentum, price below all major EMAs.
– Hourly: Recovering, pushing into the 200 EMA with strong short-term momentum.
– 15-Minute: Bullish micro-trend, extended near intraday resistance.
This is a classic countertrend bounce: lower timeframe strength trying to climb out of a higher timeframe hole. Combine that with Extreme Fear on sentiment and rising DEX fees on key Ethereum-native venues like Uniswap and Curve, and you have a market that is bruised but still active. Flows are there, but positioning is cautious and defensive.
Scenarios for Ethereum Price Today
Bullish Scenario
For the bullish case, $ETH needs to turn this bounce into something more than just a dead-cat move. On the intraday side, the first step is a clean break and hold above the hourly 200 EMA (~$1,925) and hourly R1 around $1,930. That would open a move toward the daily pivot resistance $1,963–$1,965, and if momentum stays strong, toward the daily Bollinger midline near $1,990.
A stronger version of the bullish path would involve daily closes above the 20-day EMA (~$2,050). That would start to shift the daily narrative from trend rally to sell toward potential base building. In this scenario, daily RSI would likely push back into the mid-40s or higher, and MACD would continue to contract upward, indicating the downtrend is losing its grip.
What invalidates the bullish scenario?
If $ETH fails at the hourly 200 EMA and rolls over back below the daily pivot at $1,905, with daily RSI sliding closer to 30, the idea of a sustainable bounce loses credibility. A break back under $1,865 (daily S1) would strongly argue this was just a textbook squeeze in a bear trend.
Bearish Scenario
The bearish scenario leans on the dominant daily trend. Under this view, current strength is simply positioning being cleaned up before the next leg lower. Bears will be watching for failure around $1,925–$1,965, where the hourly 200 EMA, intraday resistance, and daily pivot band cluster together.
If price rejects these levels and slides back below $1,905, then $1,865, it opens the door to a retest of the lower daily Bollinger band near $1,846, and potentially lower. In this path, daily RSI would likely dip toward or into oversold, and MACD would roll back down, restoring strong downside momentum.
What invalidates the bearish scenario?
A decisive daily close above $2,050 (20-day EMA) would start to break the downtrend’s back. If price can then hold above that moving average on pullbacks, the simple sell all rallies playbook stops working. Bears would also lose short-term control if $ETH can establish multiple hourly closes above the 200 EMA with RSI cooling off instead of spiking down again.
Positioning, Risk, and Uncertainty
The Ethereum price today is in an uncomfortable middle ground: oversold enough to bounce, not broken enough to call a bottom. Daily structure is still bearish, while intraday traders are trying to squeeze a bit more upside out of the move.
Volatility is moderate-to-high across timeframes, meaning levels matter but can be pierced intraday. The key zones to watch are:
– Support: $1,905 (daily PP), then $1,865 (daily S1), and the $1,846 lower Bollinger band.
– Resistance: $1,925–$1,930 (hourly 200 EMA & R1), then $1,960–$1,990 (daily R1 and mid-BB), and finally $2,050 (20-day EMA).
In this kind of structure, chasing late in either direction carries risk. The higher timeframe trend still favors sellers, but fear is already high and short-term indicators are stretched to the upside. Traders should be aware that both sharp squeezes and fast rejections are on the table as liquidity thins out in a fearful market.
Overall, Ethereum is not in a clear bottoming pattern yet, but it is trying to stabilize. Whether this is the start of a larger reversal or just another pause before more downside will be decided around the levels outlined above for the Ethereum price today.
