

Ethereum price prediction for November stays bearish below $2,315, the 200-day average $ETH needs to reclaim after October’s 16.1% drop.
Ethereum’s November Outlook Hinges on $2,315
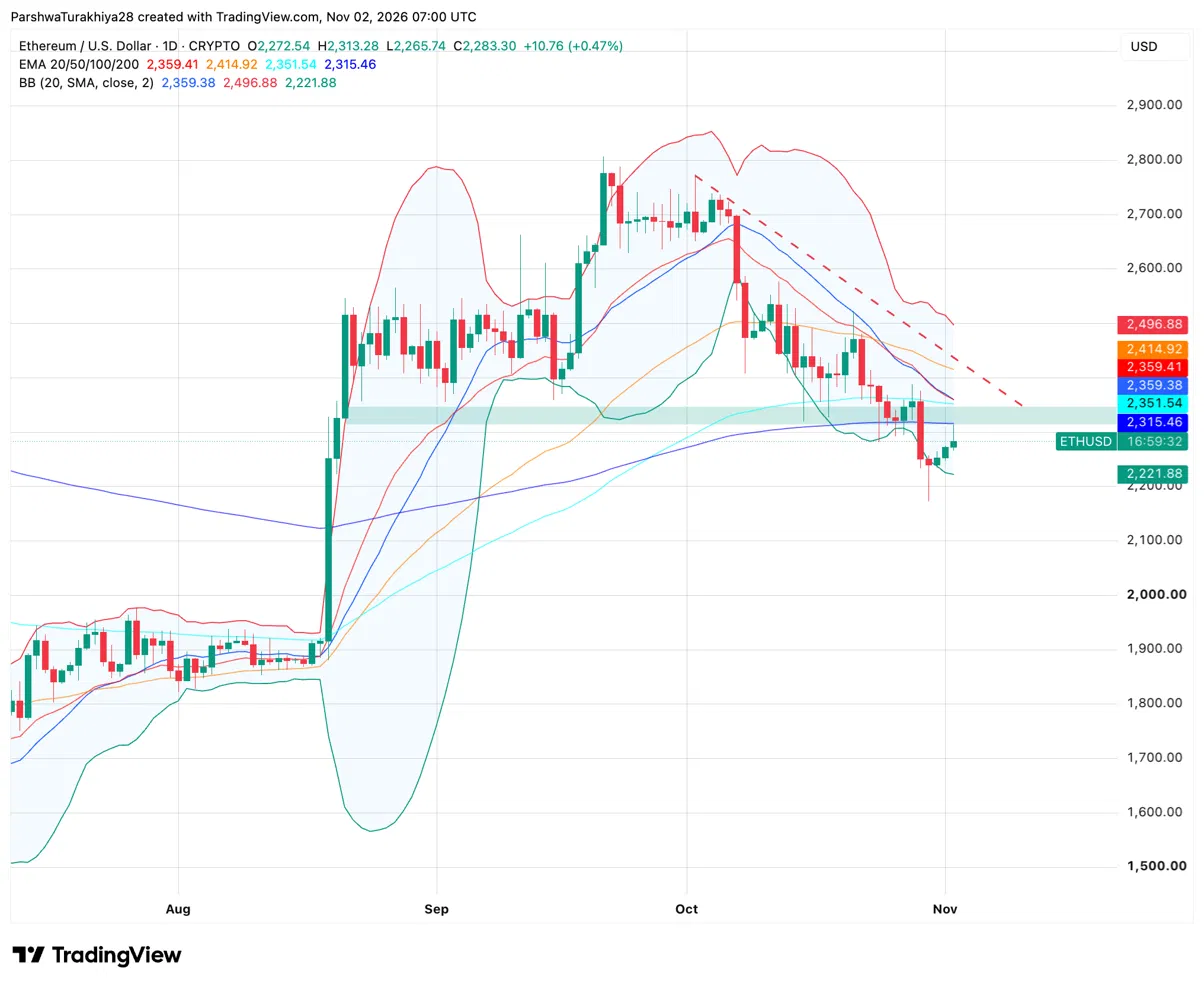
$ETH rose 0.47% to $2,283.30, about 1.4% below its 200-day EMA at $2,315.46. A daily close above that average would be the first sign that the late-October rebound is gaining strength.
Buyers would then face resistance between $2,351 and $2,360. The 100-day EMA sits at $2,351.54, while the 20-day EMA and Bollinger Band midline both sit near $2,359. Above that range, the next hurdles are the 50-day EMA at $2,414.92 and a falling trendline near $2,440.
Related: Bitcoin Price Prediction November 2026: Can BTC Reclaim $80,225 as ETF Flows Turn Negative?
While $ETH trades below $2,315, a November retest of $2,222 looks more likely than a rally above $2,415. The lower Bollinger Band sits at $2,222. A daily close below it would bring the late-October low near $2,170 back into view.
$ETH Support and Resistance Levels, November 2026
| Type | Price | Why it matters |
| Resistance | $2,315 | 200-day EMA |
| Resistance | $2,360 | 20-day EMA and Bollinger midline, beside the 100-day at $2,352 |
| Resistance | $2,415 | 50-day EMA |
| Support | $2,222 | Lower Bollinger Band |
| Support | $2,170 | Late-October wick low |
| Support | $2,000 | Round level |
US Spot Ethereum ETFs Post Their Largest Monthly Outflow as a Three-Month Inflow Run Ends
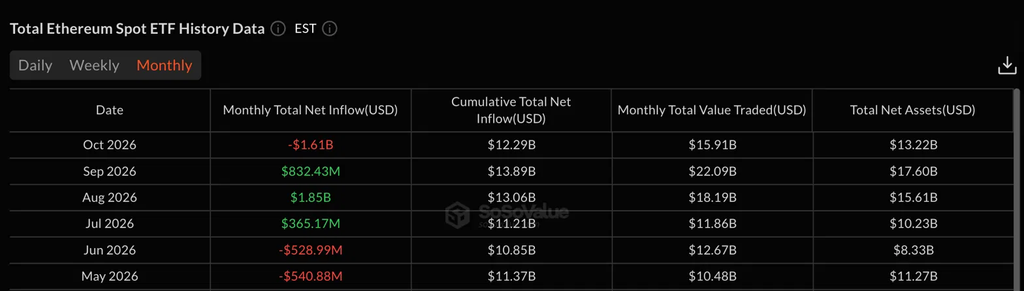
US spot Ethereum ETFs lost $1.61B in October, ending three straight months of inflows that took in about $3.05B between July and September. A report on the flows calls it the largest monthly outflow since the funds launched in July 2024.
Related: Beam Price Prediction: BEAM Faces Selling Pressure as Open Interest Surges
It came as $ETH fell 16.1%, its weakest October since 2016. Cumulative net inflows slipped to $12.29B, and total net assets dropped about 25% to $13.22B from $17.60B at the end of September.
Raoul Pal Frames an $18,000 Ethereum Scenario Around Government Debt Refinancing
A Crypto Nutshell video built on Raoul Pal’s Token2049 keynote and later interviews argues that refinancing US government debt will keep pushing new liquidity into markets. It cites a Joint Economic Committee estimate that about a third of US marketable debt matures within 12 months, with total federal debt above $40 trillion.
- Rates: Pal expects the next 100 basis points of Fed moves to be cuts rather than hikes, after the September hike to a 3.75% to 4% range.
- Ethereum link: The video says about $300 billion of stablecoins are in circulation and roughly 48% sit on Ethereum, citing DefiLlama.
- Scenario: In Pal’s trend-channel work, $ETH reaches about $18,000 around the second quarter of 2027 if it tops out one standard deviation above trend. He also showed an extreme case near $60,000 that he said is not a prediction.
From $2,283.30, the $18,000 scenario would be about 7.9 times today’s price.
Ethereum Fell 16.1% in October. How Often Does It Rebound in November?
$ETH fell 16.1% in October, its third straight October loss. Only October 2016 was worse in CryptoRank’s 12-year record, when $ETH fell 16.7%. The median October gain was 1.42%.
$ETH has gained 4.03% on average in November, but it rose in only five of 11 years. Three big rallies explain the gap. $ETH gained 58.7% in 2020, 47.4% in 2024 and 46.2% in 2017. It lost about 13% on average across the other eight Novembers.
After an October loss, $ETH fell again in November in three of four previous cases. The 2024 rally was the only exception. $ETH also fell in both previous U.S. midterm Novembers, losing 42.5% in 2018 and 17.6% in 2022.
What would those returns mean from $2,283?
- Downside: A repeat of November’s median loss of 1.96% would put $ETH near $2,239, just above support at $2,222.
- Upside: A repeat of November’s average gain of 4.03% would put $ETH near $2,375. Buyers would first need to clear the 200-day EMA near $2,315, then resistance around $2,359.
Ethereum Price Prediction: Week-by-Week Forecast for November 2026
The base case has $ETH capped below the $2,315 to $2,360 cluster, retesting the $2,222 lower band at least once, and ending the month in a $2,200 to $2,400 range.
| Period | Expected range | Key levels | What decides it |
| Nov 1 to 7 | $2,180 to $2,360 | $2,222 support, $2,315 resistance | Whether the 200-day EMA is reclaimed |
| Nov 8 to 14 | $2,150 to $2,400 | $2,222 support, $2,360 resistance | A test of the EMA cluster |
| Nov 15 to 21 | $2,100 to $2,420 | $2,170 support, $2,415 resistance | Whether ETF outflows continue |
| Nov 22 to 30 | $2,050 to $2,500 | $2,222 support, $2,415 resistance | Direction into month-end |
Related: MEET48 Price Prediction: Can a 208% Weekly Rally Push IDOL Toward $0.030?
FAQs
$ETH stays bearish below $2,315 and could move toward $2,415 if it closes above the 200-day EMA and the 20-day EMA at $2,359. A daily close below the lower Bollinger Band at $2,222 would put the $2,170 late-October low in play.
November has been mixed, with a median return of -1.96% and only 5 of 11 completed Novembers positive, according to CryptoRank data. The +4.03% average is lifted by 2020, 2024 and 2017, and $ETH fell in both midterm-year Novembers on record, 2018 and 2022.
US spot Ethereum ETFs lost $1.61B in October, ending three straight months of inflows, according to SoSoValue. Cumulative net inflows now stand at $12.29B.
$ETH fell 16.1% in October, its weakest October since 2016, according to CryptoRank data, while US spot Ethereum ETFs lost $1.61B. The chart shows price below all four daily EMAs, but none of the data in this analysis ties the drop to a single cause.




Add A Comment
Comments are closed.