
Ethereum ($ETH) traded at $1,906.61 on November 14, down 10.38% for the week, TradingView data showed. Earlier in the week, the cryptocurrency had reached $2,160.50 before dropping to $1,878.
The decline extends a correction that began after $ETH failed to break above $2,807. Since then, Ethereum has formed a series of lower highs and lower lows on the weekly chart. Attention has now turned to support just below the current price.
Ethereum Price Faces Further Losses Below $1,853 Support
The first level to watch is $1,875, the lower boundary of the Murrey Math indicator's trading range. A further support level lies slightly lower, at $1,853.62. If Ethereum closes the week below $1,853 and then fails to reclaim that level, selling could extend toward the $1,385-$1,571 region.
That area has withstood selling pressure in the past. $ETH recovered from this zone in 2025 and eventually traded above $4,800. Buyers returned to the same region in 2026, prompting a recovery toward $2,807.
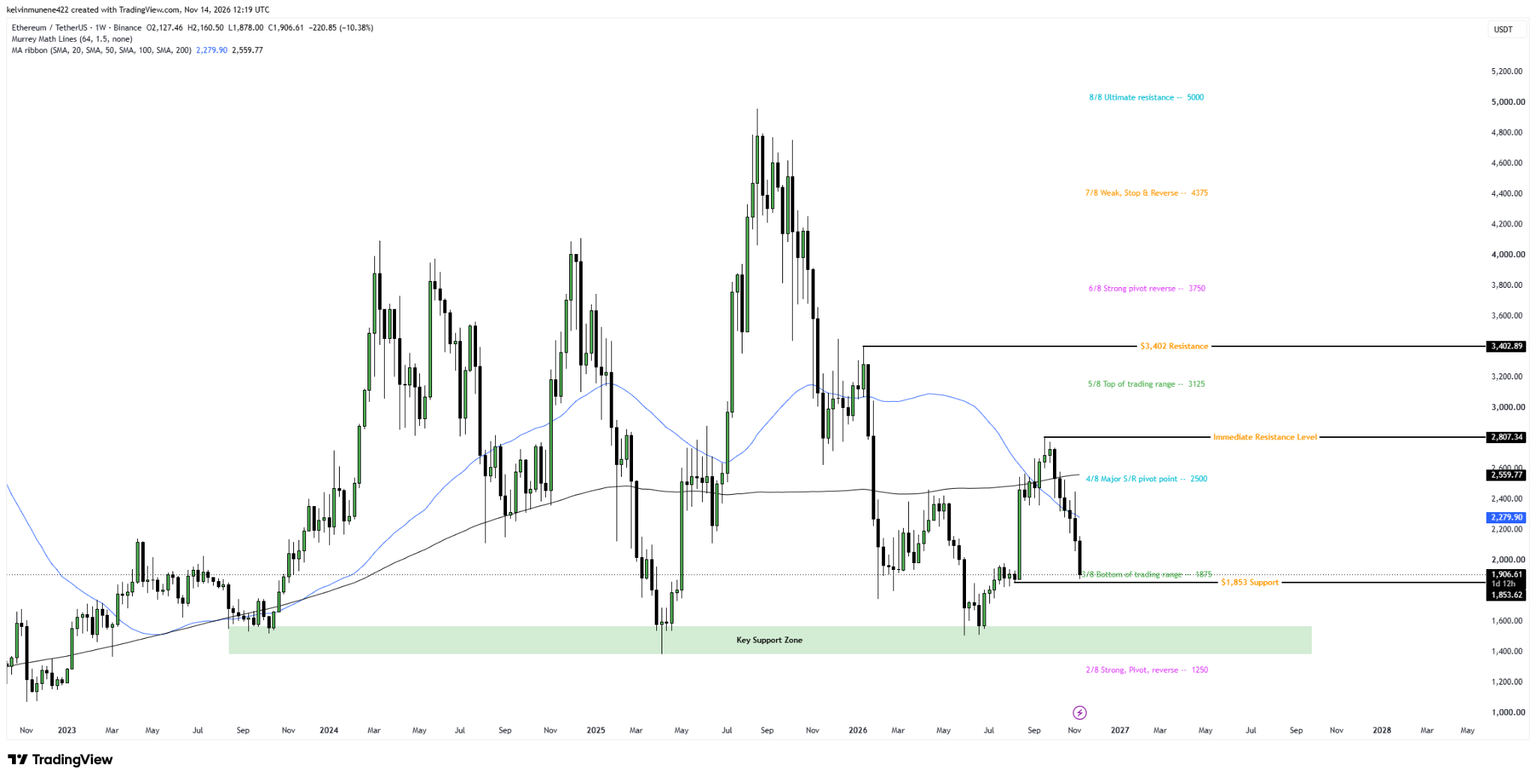
Ethereum has, however, lost roughly 60% of its value from the $4,800 region. Below the historical support zone, the Murrey Math indicator identifies another potential reversal level at $1,250.
Ethereum Trades Below Key Moving Averages as Momentum Weakens
The weekly chart also shows $ETH below its 50-week and 200-week simple moving averages, at $2,279.90 and $2,559.77, respectively. The lower average continues to slope downward. If Ethereum recovers, the first of these averages could act as resistance.
Further up, the $2,500 Murrey Math pivot is near the second moving average at around $2,560. Resistance also sits at $2,807.34, where the previous recovery stalled. A break above that level could put $3,125 in reach, followed by another horizontal resistance level at $3,402.89.
Follow us on X for real-time crypto updates.
Ethereum Price Outlook Hinges on Weekly Support
For now, $ETH remains above the $1,853-$1,875 support region. If buyers defend this area, the cryptocurrency could consolidate or attempt a recovery toward $2,279. However, an extended period of trading below $1,853 could leave $ETH vulnerable to a deeper correction. At the time of the analysis, the weekly candle was still open, so a breakdown had not yet been confirmed.
Ethereum Price Resistance Levels
| Resistance Level | Significance |
| $2,279.90 | Weekly moving average |
| $2,500–$2,559.77 | Pivot and moving average resistance |
| $2,807.34 | Previous rejection level |
| $3,125–$3,402.89 | Higher resistance levels |
Bullish Case
If buyers hold $1,853, $ETH could move back toward $2,279 and later test $2,500.
Bearish Case
A weekly close below $1,853, however, could put the $1,385-$1,571 demand zone in focus.
Neutral Case
Meanwhile, $ETH could continue trading around $1,853-$1,875 without establishing a clear direction.
Ethereum Price FAQs
1. Why Is Ethereum Price Falling?Selling pressure continues to weigh on $ETH, and its weekly market structure remains bearish.
2. What Is Ethereum’s Critical Support Level?Immediate horizontal support is at $1,853.62.
3. Can Ethereum Fall Below $1,500?That remains a possibility if $ETH falls below $1,853 and fails to recover.
4. What Could Strengthen Ethereum’s Bullish Outlook?A recovery above the weekly moving average at $2,279.90 could improve the technical outlook.
Subscribe to our YouTube channel for the latest crypto news.
Related: XRP 6-Week Bearish Sentiment Returns to 2026 Extremes: Could the Price Fall Further?