


Meanwhile, selling activity among Ethereum’s earliest investors introduced another important factor into the recovery story.
Ethereum OG whales cash out after years
According to Lookonchain, an early Ethereum investor reportedly sold 3,000 $ETH valued approximately $7.23 million. Originally, the investor purchased the tokens nine years ago at just $18.83 each, which secured a reported 128-fold return.
Beside that, another Ethereum OG separately sold 1,000 $ETH after acquiring tokens during Ethereum’s initial coin offering. This investor originally purchased 100,000 $ETH at around $0.31 per token. The two long-term holders together sold 4,000 $ETH, which highlighted renewed selling activity among Ethereum’s earliest investors.
Even though the reported exchange withdrawals implied limited available supply, the whale transactions showed continued selling among long-term investors.
Also notably, Ethereum’s derivatives market also highlighted persistent selling pressure, beyond these individual sales.
Futures sellers maintain control over $ETH
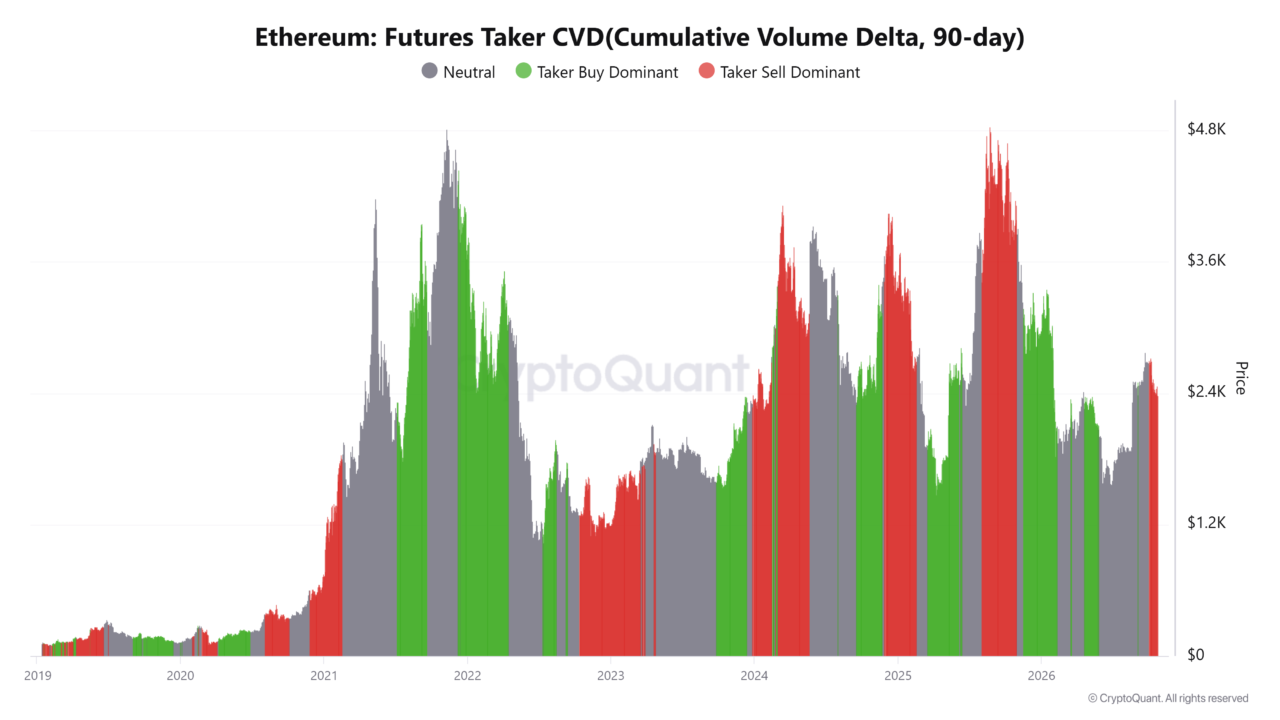
As per CryptoQuant analytics, Ethereum’s Futures Taker CVD continued showing seller dominance, which implied sustained aggressive selling activity. In particular, this indicator measured the cumulative divergence between market buy and sell orders across the Futures markets of $ETH.
The seller-dominant reading therefore indicated that aggressive sellers continued outweighing buyers throughout the period observed. This derivatives positioning was in contrast with the considerable exchange withdrawals reported by Santiment.
Consequently, such positioning could likely invalidate recovery prospects, especially in case the aggressive Futures selling persists alongside the prevailing weak $ETH price action.
Can Ethereum defend $2,300?
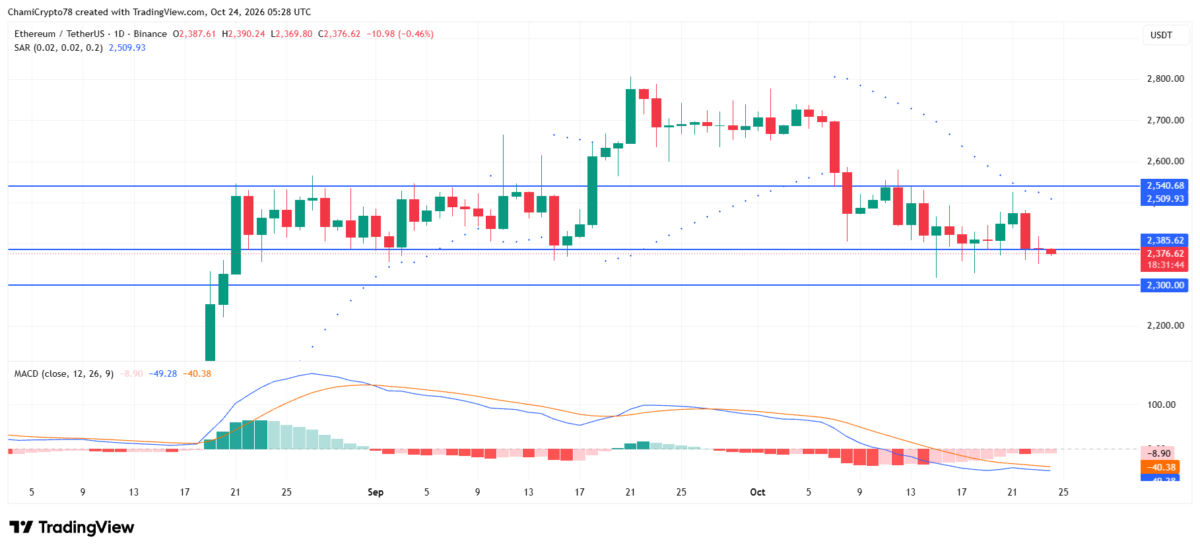
The daily timeframe chart highlighted continued weakness after $ETH failed to sustain its earlier recovery toward the $2,540.68 price level. The altcoin subsequently pulled back toward $2,376.62, losing its key support at the $2,385.62 price level.
Notably, the latest candles highlighted repeated attempts to stabilize around this zone, but the bulls did not manage to establish a convincing rebound.
Meanwhile, the Parabolic SAR indicator remained above the prevailing market value at $2,509.93 as of writing, strengthening the current bearish structure.
Furthermore, the MACD indicator maintained a bearish crossover. Notably, the indicator’s negative histogram reading of -8.90 further validated that the bears retained the technical advantage.
Overall, the bearish technical indicators for now outweighed the bullish implications of exchange withdrawals. Unless the bulls reclaim the $2,385 support, $ETH could face further price decline toward $2,300.
Final Thoughts
- Ethereum’s exchange outflows reached a four-month high, but early investors continued selling their holdings.
- Persistent Futures selling and bearish indicators left $ETH facing another potential decline toward $2,300.
