
Ethereum is holding the lower edge of its green Gaussian Channel, keeping the short-term bounce setup alive near $2,100. However, whale count data shows large $ETH holders have been leaving or consolidating positions, putting the $2,000 support level back in focus.
Ethereum Price Backtests Green Gaussian Channel as $2,100 Support Holds
Ethereum is backtesting the green Gaussian Channel on the daily Bitstamp chart shared by Sky on X, with price holding near the lower channel area for several sessions.
The $ETH/USD chart shows Ethereum trading near $2,110 after pulling back from the recent range near $2,370. The latest candles sit close to the lower edge of the green Gaussian Channel, where the analyst marked a possible support reaction.
$ETH/USD Daily Gaussian Channel Chart. Source: Sky on X
The channel had already flipped from purple to green. That matters because the previous purple phase showed weaker trend conditions, while the green phase points to a possible recovery setup.
However, $ETH still needs to hold the current support area. The chart shows the lower channel band near $2,102, while price remains only slightly above it.
A daily close below this zone would weaken the backtest and could bring the lower range near $2,025 back into focus.
If Ethereum holds the channel, the first upside level sits near $2,236, where the midline of the green channel is located. After that, $ETH would need to reclaim the upper area near $2,370 to show stronger momentum.
For now, the chart shows a clean backtest, not a confirmed breakout. Ethereum must defend the green Gaussian Channel to keep the bullish structure active.
Ethereum Whale Count Drops as $2,000 Support Comes Into Focus
Ethereum whale activity is weakening, according to the Glassnode chart shared by Ali Charts on X.
The chart shows the number of $ETH whale addresses trending lower over the past two months. Ali Charts said around 60 whale addresses holding 10,000 $ETH or more have either emptied or consolidated their balances.
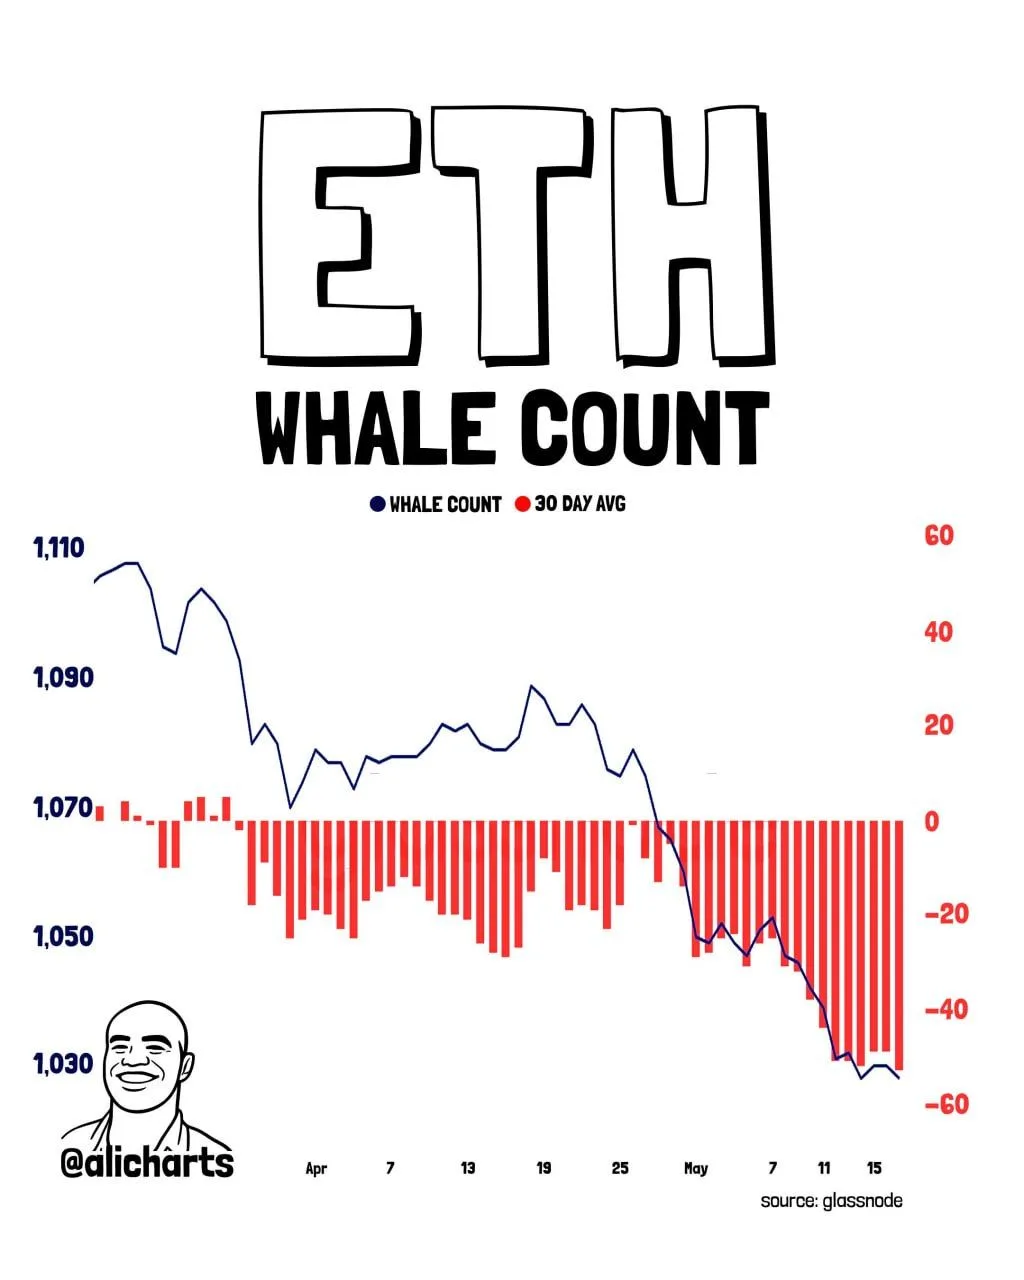
$ETH Whale Count Chart. Source: Ali Charts on X
The blue whale count line has moved down from around 1,110 to near 1,030. At the same time, the red 30-day average bars stayed negative for most of the period, showing a steady decline in large-holder activity.
This matters because whale exits can signal profit-taking, asset relocation, or lower confidence from large holders. The analyst also linked the whale decline to recent heavy exchange inflows, which can add selling pressure if large wallets move $ETH to trading platforms.
However, the chart does not prove that every whale sold. Some wallets may have consolidated funds, moved assets to custody, or changed wallet structure. Still, the drop shows that fewer large addresses now hold 10,000 $ETH or more.
For price, the key level is $2,000. If Ethereum loses that psychological support, the chart’s bearish reading would strengthen.
For now, Ethereum whale count is falling, and large-holder activity adds pressure to the short-term $ETH outlook.