
Ethereum price action continues to compress within a well-defined range after its sharp early-year decline, leaving traders focused on a decisive breakout. The daily chart shows a market that has cooled from aggressive selling pressure into a tighter consolidation phase.
This shift suggests a pause rather than a full reversal. Consequently, market participants now watch key levels closely as volatility contracts and positioning builds. The broader structure still favors caution, yet subtle changes in momentum hint that a larger move may soon unfold.
Range Compression Signals Imminent Move
$ETH trades between $2,050 and $2,350, forming a clear horizontal range. This zone reflects a balance between buyers and sellers. However, repeated rejections near $2,350 confirm persistent supply pressure. At the same time, higher lows continue to develop, signaling gradual buyer interest.
Additionally, Bollinger Bands have tightened significantly, indicating reduced volatility. This setup often precedes a strong directional move.
Moreover, price remains below the 50, 100, and 200 EMAs, reinforcing a bearish bias. Still, the flattening of shorter-term averages suggests selling pressure is weakening.
Fibonacci levels add further context. $ETH struggles below the 0.5 retracement near $2,570, highlighting limited bullish strength. Consequently, bulls must reclaim this level to shift momentum convincingly.
Key Levels Define Market Direction
Support remains firm at $2,080 to $2,100, where price has bounced multiple times. A breakdown below this zone could trigger a move toward $2,000. Furthermore, losing that psychological level may expose the $1,740 swing low.
Related: $XRP Price Prediction: Cup And Handle Projects $1.70 As $XRP Posts Strongest ETF Week In 2026
On the upside, resistance stands between $2,330 and $2,380. A confirmed breakout above this range could open the path toward $2,570.
Beyond that, $2,770 and $3,040 emerge as stronger resistance zones. Hence, the $2,300–$2,350 region acts as the critical pivot for the next trend.
Derivatives and Flows Reflect Cautious Positioning
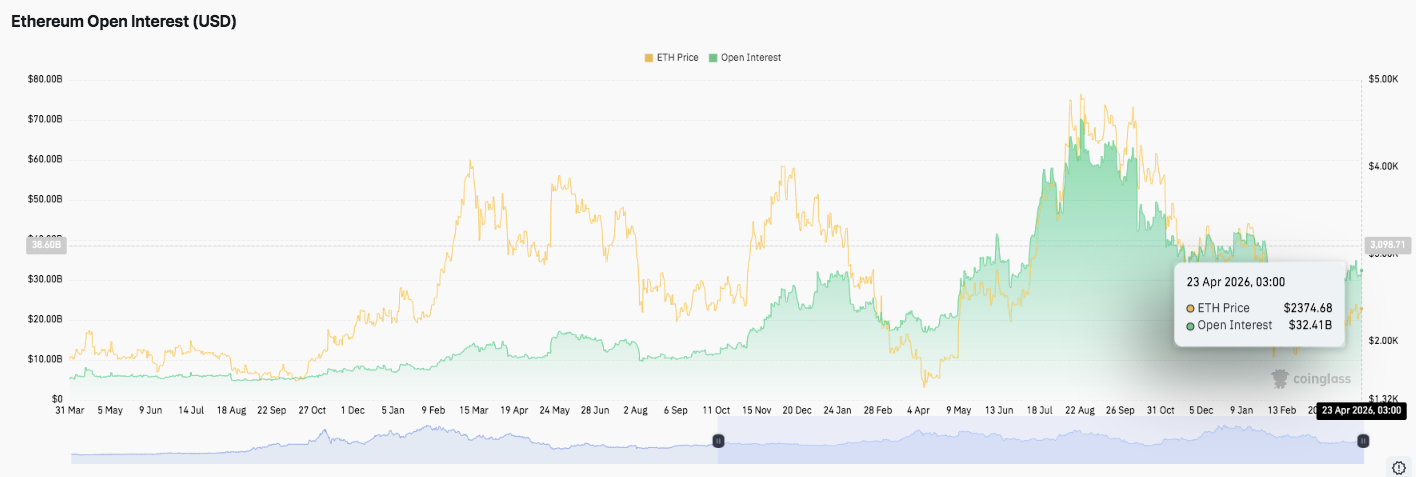
Ethereum open interest shows a steady upward trend despite periodic pullbacks. This pattern indicates growing participation in derivatives markets. Significantly, recent stabilization suggests traders maintain exposure rather than exiting positions.
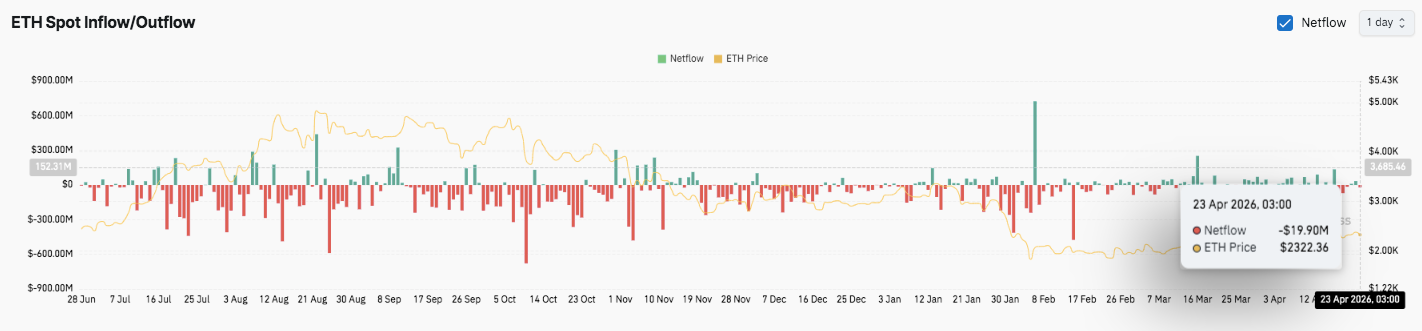
Meanwhile, spot flows reveal a more reactive environment. Capital moves in and out based on price swings rather than long-term conviction. Early accumulation gave way to outflows during weakness. However, intermittent inflow spikes point to opportunistic buying, likely from larger players.
Technical Outlook for Ethereum ($ETH) Price
Ethereum remains in a clearly defined technical structure as it trades through a prolonged consolidation phase after its earlier bearish breakdown. Heading into the next major move window, key levels are well established and continue to guide market behavior.
Upside levels: $2,330, $2,380, and $2,570 act as immediate resistance hurdles. A clean breakout above this cluster could extend momentum toward $2,770 and $3,040, where stronger Fibonacci resistance aligns with previous structural rejection zones.
Related: Spark Price Prediction: SPK Surges 78% as Price Eyes $0.070 After Breakout
Downside levels: $2,080 serves as the first major support, followed by $2,000 as a critical psychological and structural base. A deeper breakdown would expose $1,970 and potentially $1,740, which marks the last major capitulation low.
Resistance ceiling: The $2,570 level (0.5 Fibonacci retracement) remains the key threshold to flip for any meaningful bullish transition. Additionally, the 50–200 EMA cluster above current price continues to act as dynamic resistance, reinforcing the broader bearish-to-neutral bias.
The technical picture suggests Ethereum is compressing inside a broad range between $2,050 and $2,350. Consequently, volatility is tightening, and price is coiling for an expansion phase. This setup often precedes sharp directional moves once liquidity is taken on either side of the range.
Will Ethereum Break Higher or Lower?
Ethereum’s near-term direction depends on whether buyers can defend the $2,080–$2,100 support zone long enough to challenge the $2,350 resistance ceiling. Sustained buying pressure above this range would signal accumulation and open the path toward $2,570 and $2,770.
Moreover, a confirmed breakout above $2,350 with strong volume could shift momentum decisively in favor of bulls. This would also improve EMA alignment and strengthen mid-term structure.
However, failure to hold $2,080 would weaken the current base. Consequently, Ethereum could retest $2,000 and potentially slide toward $1,740 if selling pressure accelerates.
For now, Ethereum remains in a pivotal consolidation zone. Additionally, tightening volatility and mixed flow behavior suggest an imminent expansion phase. The next breakout direction will depend on conviction, liquidity shifts, and whether resistance or support gives way first.
Related: Cardano Price Prediction: Funding Cut and Visa Card Launch Set Up Breakout Test at $0.2514