[ad_1]
- Bitcoin price steadied this week, holding $84,000 support despite lingering macroeconomic uncertainty.
- Fed Chair Jerome Powell highlights the impact of larger-than-expected tariffs, high inflation risk, and slow economic growth.
- Gold upholds its bullish streak and hits new highs at $3,357 as investors sidestep Bitcoin as a safe-haven asset.
- BTC shows immense strength amid a developing bullish structure for a breakout, targeting $97,938.
Bitcoin (BTC) price consolidates above $84,000 on Friday, a short-term support that has gained significance this week. The world’s largest cryptocurrency by market capitalization continued to weather storms caused by United States (US) President Donald Trump’s incessant trade war with China after pausing reciprocal tariffs for 90 days on April 9 for other countries. Bitcoin exchanges hands at $84,605 at the time of writing on Friday, with its technical structure suggesting that a breakout may soon be imminent.
Fed Chair warns tariffs could have a larger impact on the US economy
Federal Reserve (Fed) Chair Jerome Powell expressed concerns about the current economic conditions, suggesting that the central bank could find itself in a dilemma between keeping inflation in check and supporting economic growth. “We may find ourselves in the challenging scenario in which our dual-mandate goals are in tension,” Powell said in his remarks at the Economic Club of Chicago on Wednesday.
Regarding interest rates, Powell said the central bank will respond to incoming data to inform adjustments to the current policy stance. However, if inflation spikes, the Fed is ready to hold the rates steady or consider increasing them. A slower economic growth pattern would lead to lower interest rates.
President Trump’s tariffs “are highly likely to generate at least a temporary rise in inflation.” Powell anticipates that the tariffs’ impact will be larger than expected and may result in persistent inflation.
Following the remarks, President Trump launched a direct attack on Jerome Powell in a Truth Social post, accusing the Fed Chair of being “too late and wrong.” According to the President, the Federal Reserve should have already cut interest rates because “the USA is getting rich on tariffs.” Trump added that it is time for Powell to step back and exit the Fed.
Gold soars spotlighting Bitcoin’s perceived safe-haven status
Gold prices outperformed amid lingering uncertainty over tariffs and the trade war between China and the US. The yellow metal reached a new all-time high at $3,357 per ounce on Thursday before pulling back to $3,327 at the time of writing.
While Bitcoin has steadied since the April 7 low at $74,572, its upside remains capped under $85,000. However, outflows from Bitcoin Exchange Traded Funds (ETFs), as observed since April 1, suggest that investors prefer to reduce exposure, possibly buying Gold. In a fortnight, spot BTC ETFs recorded only four days of inflows compared to nine days of outflows, per SoSoValue data.

Bitcoin ETF data | Source: SoSoValue
On the positive side, Bitcoin continues to outpace equities, weathering volatility as stock markets tumble amid President Trump’s tariff policy. China was slapped with a massive 245% tariff this week. Technology stocks like NVIDIA suffered larger drawdowns as China expanded the trade war to rare earth metals.
“Though it did not attract a safe-haven bid like gold, which hit a record $3,357, BTC’s relative stability stood out in a week marked by increasing global uncertainty,” the K33 Research weekly report highlighted.
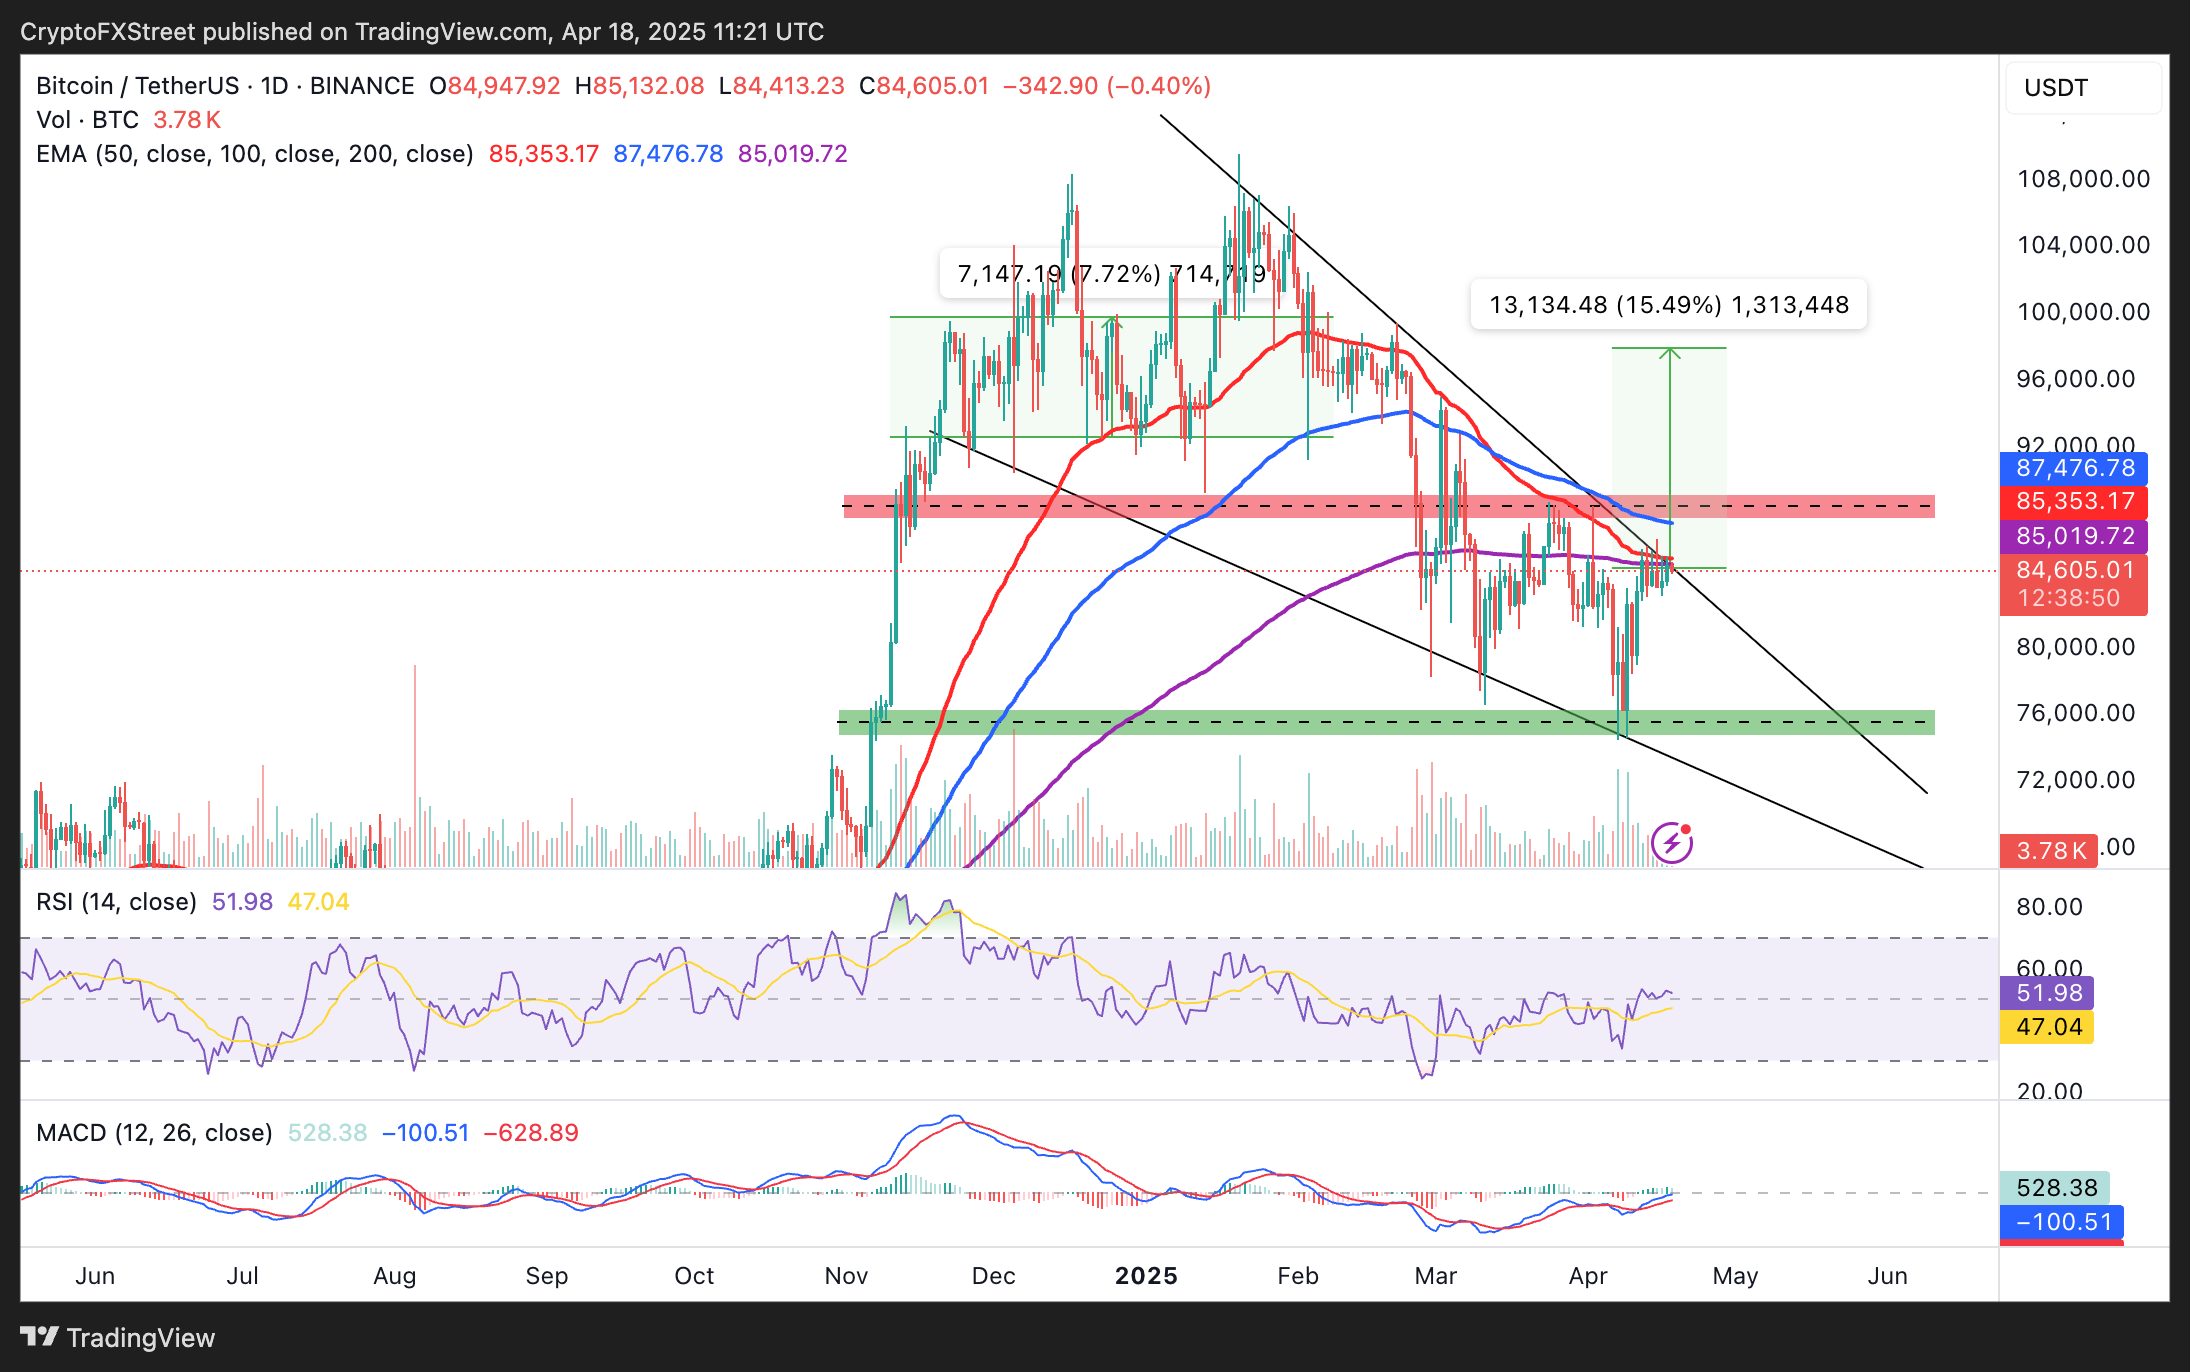
Bitcoin price could move 15% to $97,938
Bitcoin’s price is slightly below the 50-day and 200-day Exponential Moving Averages (EMAs) at the time of writing on Friday, as bulls attempt to push for a breakout from the falling wedge pattern shown in the daily chart.
A falling wedge signals a potential bullish reversal for Bitcoin’s price, suggesting bearish momentum is fading. If validated with a breakout above the upper trendline resistance, expect a 15% rally to $97,938. Traders can buy on the breakout, setting stop-losses below this trendline. The target represents the distance between the pattern’s widest points, extrapolated above the breakout point.
A crucial bullish point to consider for Bitcoin is the buy signal from the Moving Average Convergence Divergence (MACD), which manifested when the MACD line (blue) crossed above the signal line (red) on April 12. At the same time, the Relative Strength Index (RSI) indicator crossed above the center line and held at 51.97, pointing at a potentially strong bullish momentum.
Therefore, a break above the wedge pattern accompanied by high trading volume could mark the beginning of Bitcoin’s return to the $90,000 range.

BTC/USDT daily chart
On the contrary, if bulls fail to breach the wedge pattern trendline resistance and seek support above the 50-day and 200-day EMAs, traders may lack the conviction to hold their positions. In that case, planning for a sweep through liquidity at $80,000 would be prudent. If selling activities surge, a drop to April’s low of $74,508 would be on the cards.
Share: Cryptos feed
[ad_2]

