
Bitcoin ($BTC) could trade between $114,614 and $1,346,386 on December 1, 2026, according to Bitcoin Rainbow Chart projections.
According to data from the Bitcoin Rainbow Price Chart Indicator on Coinglass, the Fire Sale band at $114,614 indicates the market is significantly undervalued and could present an attractive buying opportunity.
The BUY band at $155,784 indicates a favorable entry point, while the Accumulate band at $213,858 suggests prices are relatively attractive for gradually increasing exposure.
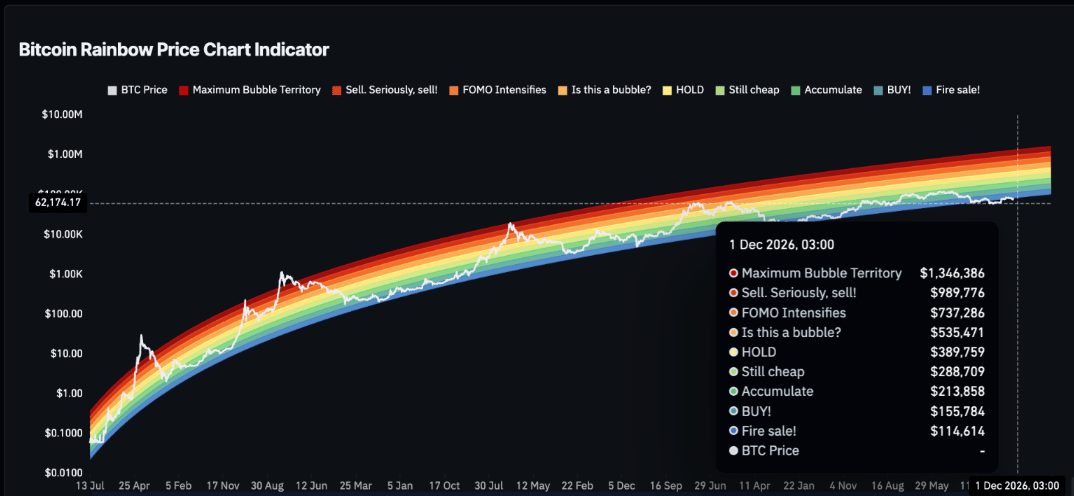
The Still Cheap band at $288,709 suggests the cryptocurrency remains relatively undervalued compared with its historical price trend.
The HODL band at $389,759 represents a valuation at which investors may consider holding their existing positions as the market advances.
Meanwhile, the Is this a bubble? band at $535,471 indicates Bitcoin could be becoming overvalued. The FOMO Intensifies band at $737,286 points to rising speculative demand and the risk that investors buy out of fear of missing out.
At higher valuations, the Sell. Seriously, sell! band stands at $989,776, indicating an increasingly expensive market in which investors may consider taking profits.
The highest band, Maximum Bubble Territory, is at $1,346,386 and represents an exceptionally overheated market with heightened downside risk.
Bitcoin price analysis
However, Bitcoin’s current market price differs significantly from the Rainbow Chart’s December projections.
At press time, $BTC was trading at $73,993, approximately 35.5% below the chart’s lowest projected valuation band of $114,614.
To reach that lower threshold by December 1, Bitcoin would need to appreciate by approximately 54.9% over the remaining 20 days.
In the near term, immediate technical levels could determine Bitcoin’s next move. Daily technical analysis places initial support near $73,083, with further support at $71,758 and $70,247.
A sustained drop below $70,247 could expose the next major support area near $68,106. On the upside, Bitcoin faces immediate resistance at $74,523, followed by hurdles at $76,438 and $78,658.
A break above $78,658 could pave the way toward $81,111, while the $84,501 area marks another significant resistance level.
Featured image via Shutterstock
Add A Comment
Comments are closed.