
Bitcoin’s price correction is showing signs of mounting investor stress, with short-term holders increasingly selling at a loss. After failing to hold its recovery above $85,000, $BTC extended its decline toward $74,000, falling below a key technical support area. More concerningly, recent on-chain data points to one of the strongest short-term holder capitulation events in recent months.
As selling pressure grows and institutional demand weakens, the key question is whether Bitcoin can stabilize near $70,000 or face another leg down.
Bitcoin Price Faces Short-Term Holder Capitulation as 47,300 $BTC Move at a Loss
Bitcoin’s latest correction is increasingly accompanied by short-term holders realizing losses. This group is generally defined as investors who have held $BTC for less than 155 days.
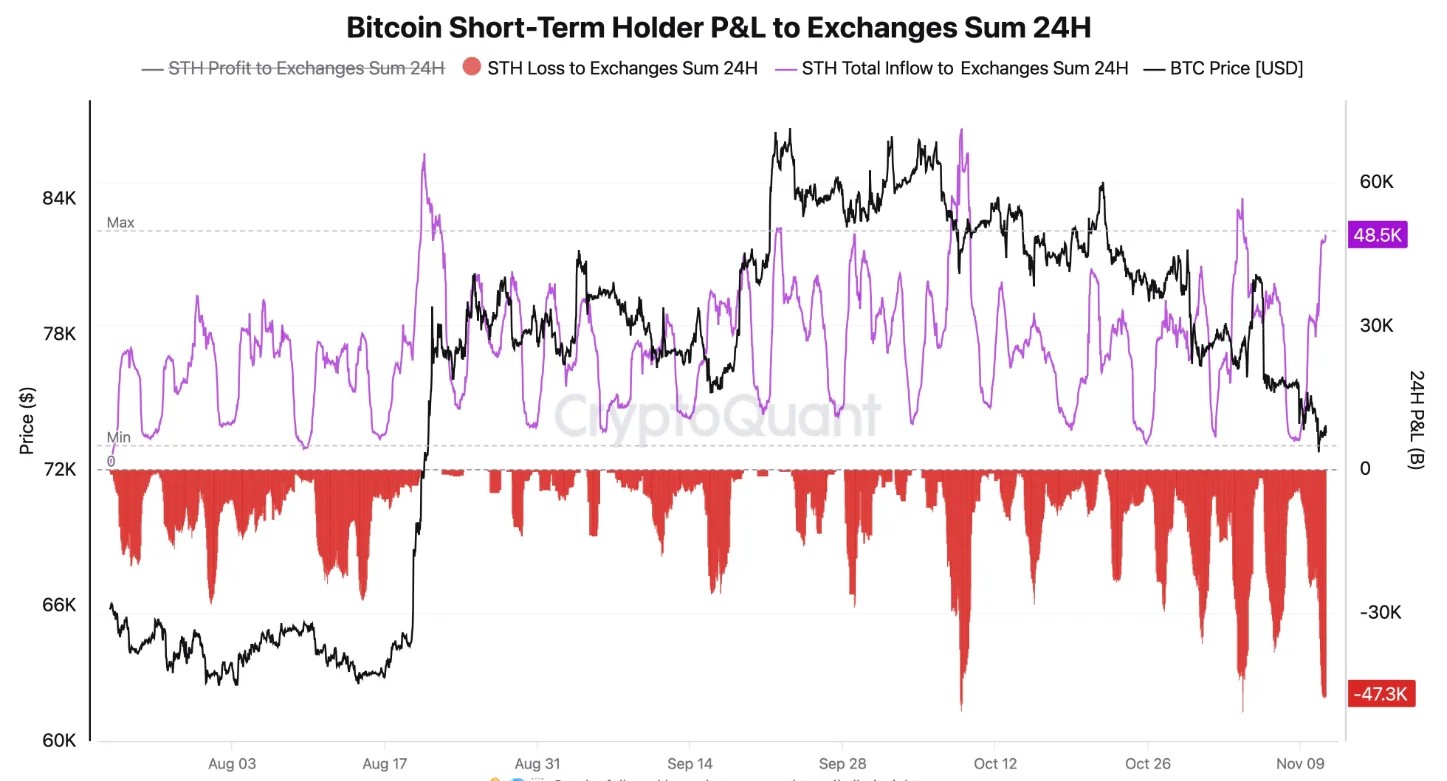
On-chain data shows that short-term holders transferred approximately 48,500 $BTC to exchanges over 24 hours, with nearly 47,300 $BTC moved at a loss. That means roughly 97.5% of the reported transfers involved positions that were underwater.
This points to a shift in Bitcoin market behavior. Earlier in October, profit-taking contributed to the correction. Recent activity, however, suggests more investors are now selling to limit losses rather than lock in gains.
Why Is Bitcoin Price Falling Today?
Bitcoin’s price decline reflects a combination of macroeconomic uncertainty, weaker institutional demand and a deteriorating market structure. Recent U.S. inflation data has renewed concerns that interest rates will remain elevated, weighing on risk-sensitive assets. Cryptocurrency markets have also faced added pressure from regulatory uncertainty and broader investor caution.
Institutional flows have weakened as well. U.S. spot Bitcoin ETFs recorded approximately $430.2 million in net outflows on November 5, reversing the positive flows of the previous session. The withdrawals added to selling pressure as Bitcoin struggled to sustain its recovery. Together, these developments have made it increasingly difficult for $BTC to attract sustained buying interest.
Can $BTC Recover or Is $70K Next?
Bitcoin’s price chart shows its short-term structure deteriorating after repeated failures near the $87,000–$88,000 resistance zone. $BTC then formed lower highs before falling below the $76,000–$77,000 support region, which had previously drawn buyers.
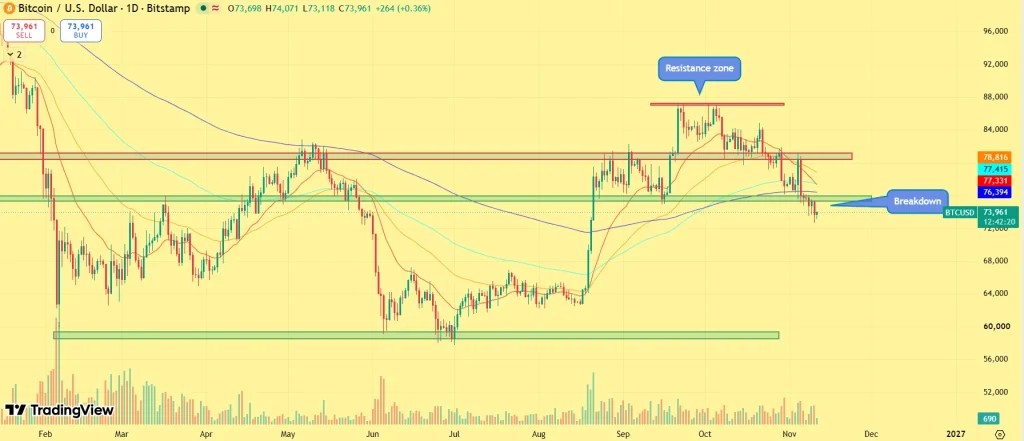
Bitcoin is now trading near $73,900, below its key moving averages. The former support area has become immediate resistance, making a move back above $76,000–$77,000 essential to improve the short-term outlook. To the downside, $72,000–$73,000 is the immediate support area to watch. A sustained break below it could expose $BTC to the psychological $70,000 level, followed by $68,000.
If selling pressure intensifies, the broader demand zone around $60,000–$62,000 could be the next major area of support. Conversely, reclaiming $77,000 could help stabilize Bitcoin’s price and open the way toward $81,000–$83,000.
Add A Comment
Comments are closed.