[ad_1]
Charles Edwards, founder of the Bitcoin and digital asset hedge fund Capriole Investments, published a detailed examination of Bitcoin’s current market phase suggesting a bullish trajectory, potentially reaching the $100,000 mark. The analysis hinges on the identification of a Wyckoff ‘Sign of Strength’ (SOS), a concept derived from the century-old Wyckoff Method that studies supply and demand dynamics to forecast price movements.
Understanding The Wyckoff ‘SOS’: Bitcoin To $100,000?
The Wyckoff Method, developed by Richard D. Wyckoff, is a framework for understanding market structures and predicting future price movements through the analysis of price action, volume, and time. The ‘Sign of Strength’ (SOS) within this methodology signifies a point where the market shows evidence of demand overpowering supply, indicating a strong bullish outlook.
Edwards’s observation of an SOS pattern in Bitcoin’s recent price movements suggests that the market is at a pivotal point, where sustained upward momentum is highly probable. In Capriole’s latest newsletter, Edwards offered a precise depiction of Bitcoin’s market behavior, highlighting a period of volatility and consolidation in the $60,000 to $70,000 range.
Related Reading: Bitcoin Bull Flag Could Predict 10% Surge To $77,000, Analyst Explains
This phase was anticipated by the hedge fund. Currently, as Bitcoin ventures above its last cycle’s all-time highs, it aligns with the predicted zig-zag SOS structure. Edwards elucidates, “It would not be surprising to see a liquidity grab at / into all-time highs […] All consolidation above the Monthly level at $56K is extremely bullish. It would be uncommon (but not impossible) for price to continue in a straight line up.”
The “zig-zag” phase also perfectly aligns with the halving cycle as BTC tends to consolidate “both months either side of the Halving.” Edwards added that “the realities of a much lower supply growth rate + unlocked pent up tradfi demand will then kick-in and launch 12 months of historically the best risk-reward period for Bitcoin.”
From a technical perspective, Bitcoin’s foray into price discovery territory above $70,000 is devoid of significant resistance levels. This opens a pathway to psychological and Fibonacci extension levels, with Edwards pinpointing $100,000 as the next major psychological resistance.
Related Reading: Bitcoin ETF Inflows Could Eclipse $1 Trillion, Predicts Bitwise CIO
The 1.618 Fibonacci extension from the 2021 high to the 2022 low is noted at $101,750, serving as a technical marker for potential resistance. Edwards reflects on investor sentiment, stating, “You can also imagine quite a few investors would be happy seeing six-digit Bitcoin and taking profit in that zone,” acknowledging the psychological impact of such milestones.

BTC Fundamentals Support The Bull Case
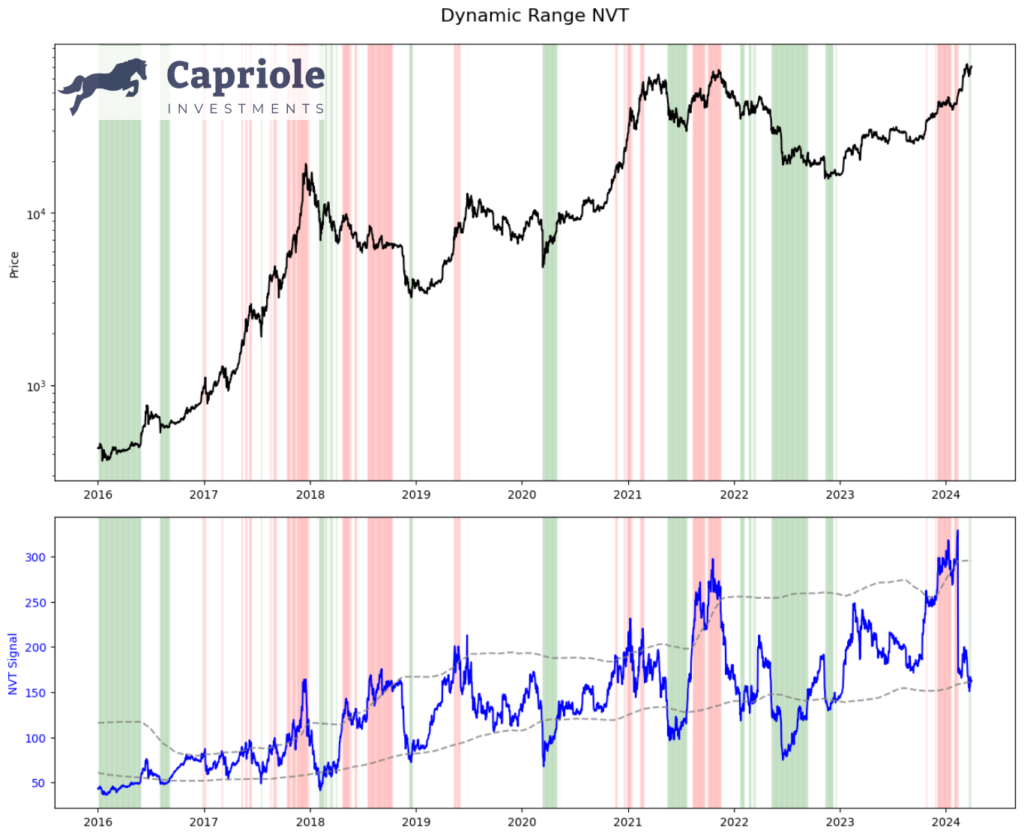
Edwards also delves into the importance of fundamentals, underscoring their role in providing a bullish backdrop for Bitcoin. The introduction of the Dynamic Range NVT (DRNVT), a unique metric to Capriole, indicates that Bitcoin is currently undervalued. Edwards describes DRNVT as “Bitcoin’s ‘PE Ratio’”, which assesses the network’s value by comparing on-chain transaction throughput to market capitalization.
The current DRNVT readings suggest an attractive investment opportunity, given Bitcoin’s undervaluation at all-time price highs. “What’s fascinating at this point of the cycle is that DRNVT is currently in a value zone. With price at all time highs, this is a promising and unusual reading for the opportunity that lies ahead in 2024. It’s something we didn’t see in 2016 nor 2020,” Edwards remarked.

With both technical indicators and fundamental analysis signaling a bullish future for Bitcoin, the anticipation surrounding the upcoming Halving event adds further momentum to the positive outlook. Despite the expectation of volatility and consolidation in the short term, Edwards confidently states, “probabilities are starting to skew to the upside once again.”
At press time, BTC traded at $69,981.
Featured image from Shutterstock, chart from TradingView.com
Disclaimer: The article is provided for educational purposes only. It does not represent the opinions of NewsBTC on whether to buy, sell or hold any investments and naturally investing carries risks. You are advised to conduct your own research before making any investment decisions. Use information provided on this website entirely at your own risk.
[ad_2]

