[ad_1]
Bitcoin price has entered a shaky phase as it hovers near $105,000, with its recent bullish momentum beginning to weaken under mounting macroeconomic pressure. The BTC price charts are flashing early signs of a potential downtrend, and if the cracks widen, a correction to $90,000 may not be out of the question. Let’s dig into the technicals, recent developments, and key price levels.
Bitcoin Price Prediction: Why is Bitcoin Losing Momentum Near $110,000?

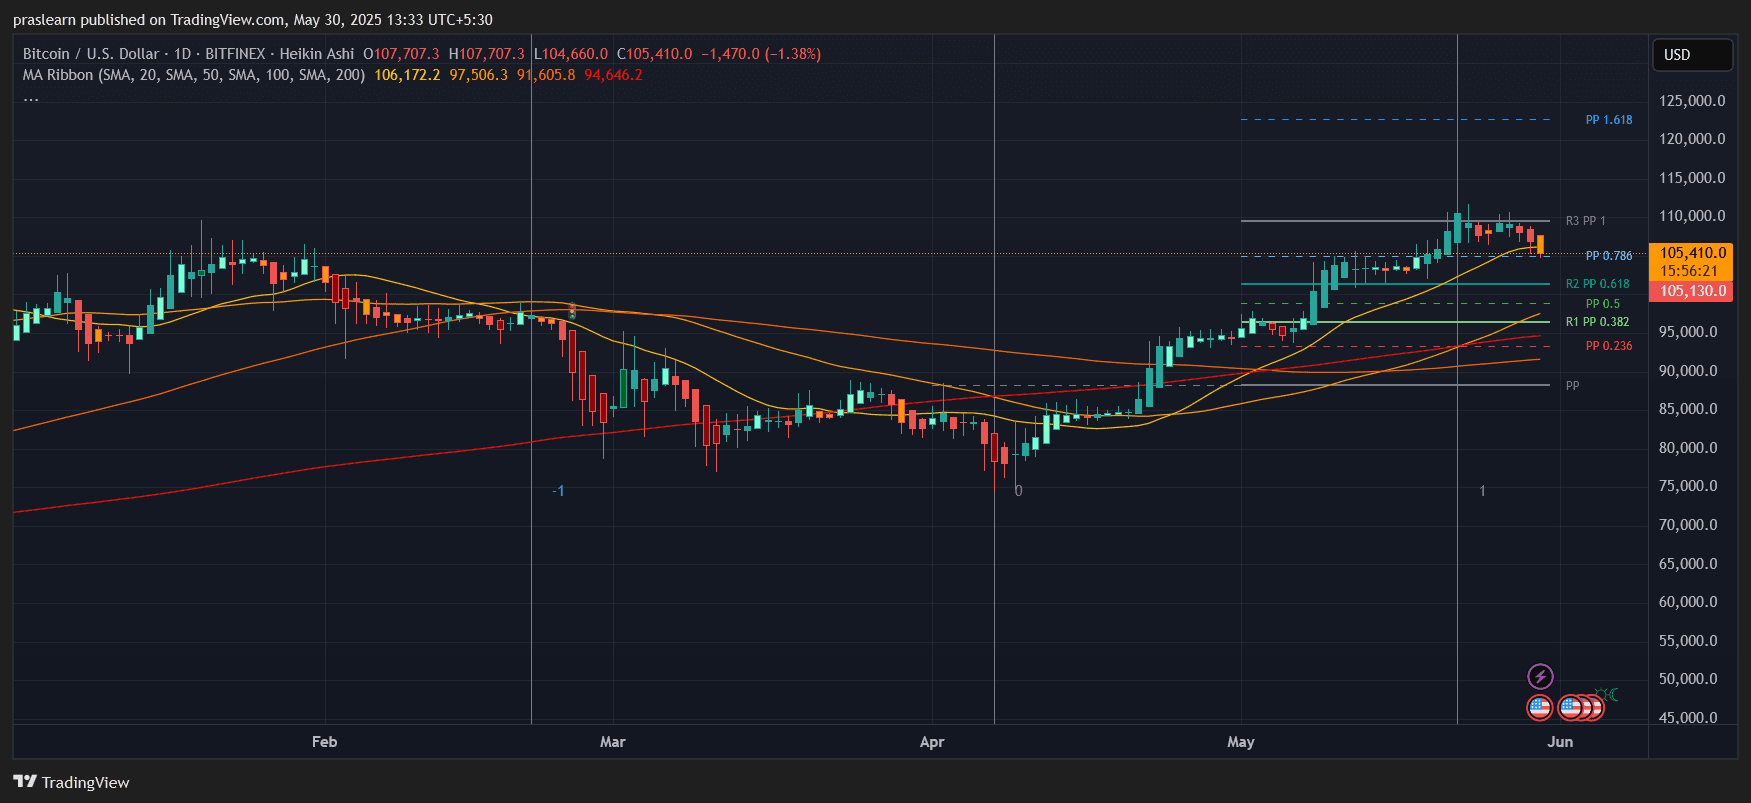
BTC/USD 1 Day Chart- TradingView
On the daily chart, BTC price recently struggled to hold above the R3 pivot zone near $110,000. After reaching a local high just under this level, sellers took control, driving the price down to $105,000. Notably, the Heikin Ashi candles show three consecutive red bars forming near a key Fibonacci pivot zone (0.786), which often signals a loss of bullish steam.
Moreover, the Bitcoin price is starting to flatten out near the 20-day moving average ($106,172). A clean break below this could trigger further downside to the 50-day SMA at $97,506 — a region that previously acted as consolidation support in April.
Hourly Chart Confirms Bearish Pressure Building

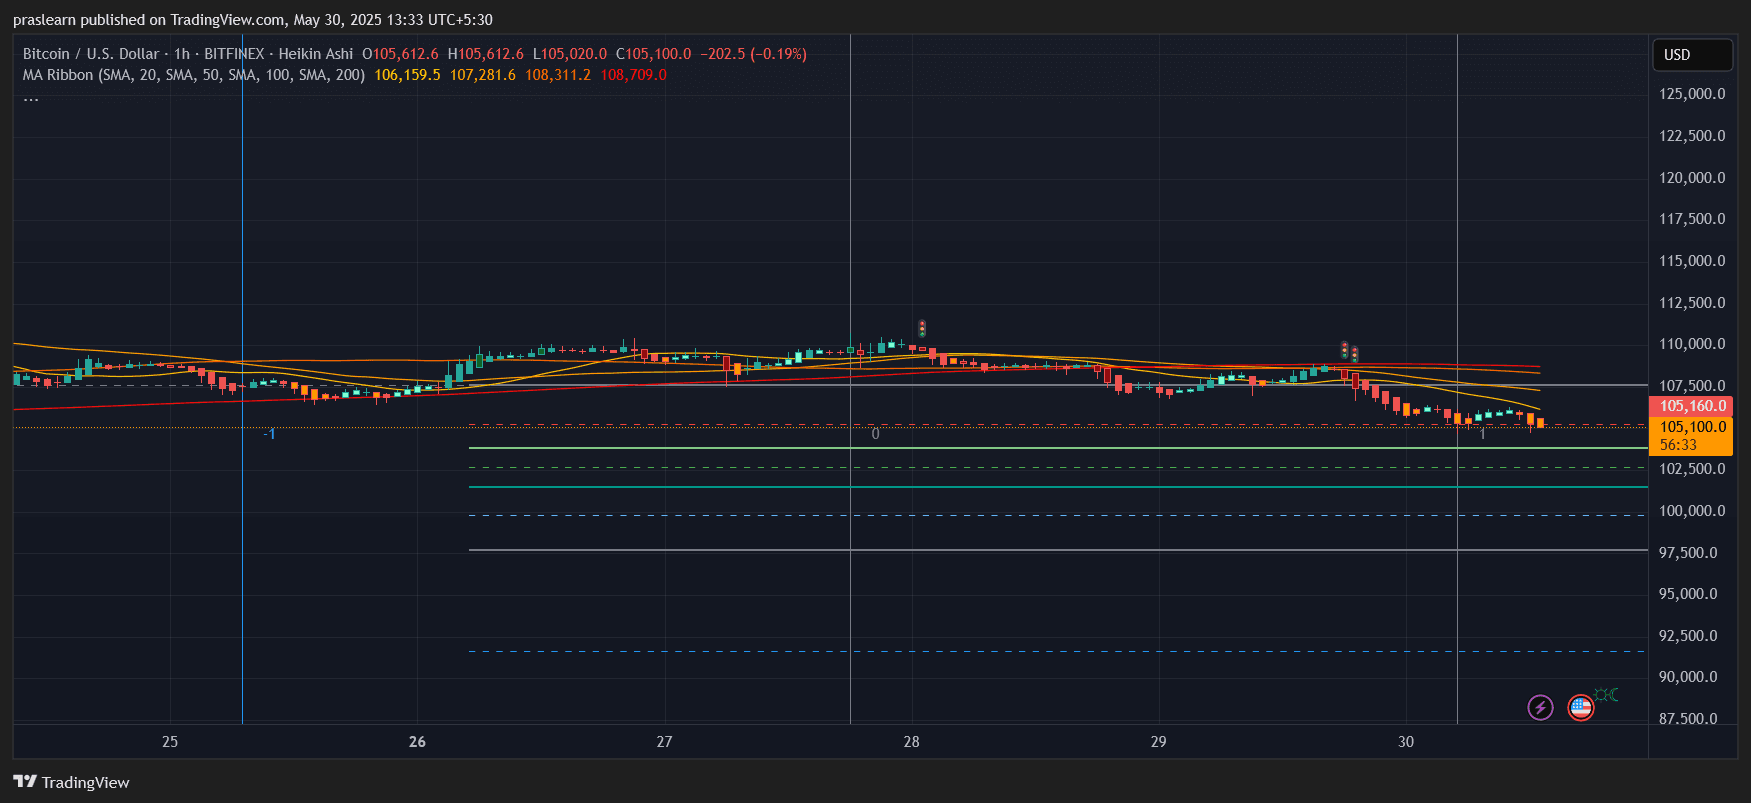
BTC/USD 1 Hr Chart- TradingView
The hourly chart gives more immediate signals of weakness. BTC price has been rejected multiple times near the 50-SMA ($107,281) and 100-SMA ($108,311), with clear lower highs forming. This structure, coupled with flat volume and a bearish alignment of the MA ribbon (20 < 50 < 100 < 200), suggests that short-term traders are losing confidence.
Bitcoin price attempted to reclaim $106K but was quickly pushed back, and the price is now hovering just above critical intraday support at $105K. If this zone breaks decisively, the next hourly support rests around $102,000.
What Could Trigger a Bitcoin Price Crash to $90,000?
Let’s break down a few key drivers that could escalate this correction:
1. Macroeconomic Instability:
Ongoing US–China trade tensions have resurfaced after trade talks stalled. Add to that the US court blocking key tariffs, which raises questions about future trade enforcement. This has created a climate of uncertainty — often bearish for high-risk assets like crypto.
2. Weak US Economic Data:
A surprise contraction of 0.2% in US GDP for Q1 2025 and a spike in jobless claims have spooked investors. Typically, such news leads to a shift toward safer assets, and Bitcoin, despite its long-term appeal, often takes a hit during immediate liquidity crunches.
3. Technical Breakdown Risk:
From the chart, a break below $105,000 (current support) opens the door to test the 0.618 Fibonacci level around $97,000. A failure to bounce here increases the risk of sliding down to $90,000 — the 0.236 level on the pivot scale and a major previous resistance that could now act as support.
Let’s run a quick Fibonacci-based scenario:
- Recent swing high: $111,800
- Swing low: $88,500
- 0.236 level = $93,730
- 0.618 level = $100,156
If $105,000 breaks and $97,000 fails, the next likely area of support sits at around $93,730 – $90,000, aligning with historical accumulation zones.
Will Bitcoin Bulls Step In?
While long-term investors may see $90K as a dip-buying opportunity, short-term traders are watching closely for any sign of a breakdown below the 20-day moving average. The 200-day SMA remains far below at $94,646 — a line in the sand that, if broken, could trigger institutional outflows.
For now, bulls must reclaim $107,000 to resume upside, but the odds seem to favor bears unless macroeconomic headwinds ease.
Bitcoin Price Prediction: Can It Rebound or Will Bitcoin Price Crash to $90,000?
Given the current technical setup and external pressure, a correction to the $97,000–$90,000 range is increasingly likely in the next 1–2 weeks unless Bitcoin price reclaims $107,500 quickly and flips it into strong support.
Traders should watch:
- $105,000 as immediate support
- $107,500 as reclaim level for bullish continuation
- $97,000–$94,000 as key downside Fibonacci targets
- $90,000 as major support from pivot and historical demand zone
If the macro landscape worsens further — say a drop in S&P 500 or oil shocks — BTC could test even $88,000 levels briefly before a bounce.
Final Take: Bearish Bias Until Proven Otherwise
Bitcoin price failure to hold above the pivot R3 zone, combined with weakening moving averages and rising economic uncertainty, points to a cautious short-term outlook. Traders eyeing leverage should prepare for volatility, while long-term holders may soon get another golden entry — possibly near $90,000. Until then, Bitcoin stays on watch.
$BTC, $Bitcoin
[ad_2]

