
Ethereum hovers at the middle Bollinger Band as support holds, and fresh liquidations hint at a fragile rebound.
Ethereum spent the past 24 hours testing market nerves around the $2,800 mark. After holding steady near the upper end of its range for most of the day, the price saw a sharp intraday drop from just below $2,845 to a low near $2,725, wiping out earlier gains. That flush was followed by a steady rebound, with ETH clawing back toward $2,800, though it still sits about 0.8% lower on the day at roughly $2,809.
Over a longer lens, Ethereum’s chart shows a slow, grinding pullback rather than a sudden collapse. In the last seven days, ETH has slipped around 4.3%. Stretch the view to 14 days and the picture looks similar, with losses deepening to roughly 6.6% as each attempt to push above $2,900 has been met with renewed supply.
Despite the pullback, Ethereum’s market cap remains above $338 billion, supported by almost $30 billion in 24-hour volume. Meanwhile, the pattern on the chart, a sudden sell-off, consolidation at the lows and a partial recovery, sets the stage for a decisive next move.
What is Ethereum’s Next Move?
Specifically, on the daily chart, Ethereum remains locked in a clear downtrend, trading below the 20-day Bollinger Band simple moving average (around $2,976) and spending most of the past month in the lower half of the volatility envelope. The latest attempt to push higher stalled almost exactly at this mid-band, and the current candle has been knocked back toward the lower band near $2,705.
Ethereum 1 Day Chart
This keeps immediate resistance clustered in the $2,950–$3,000 zone, followed by the upper Bollinger Band and recent swing area around $3,200–$3,250. As long as price holds beneath the 20-day SMA, the bears retain the technical advantage.
The lower Bollinger Band near $2,700 now doubles as short-term support, with the furthest wick low around $2,623 and then the psychological $2,500 zone acting as deeper downside levels to watch if selling resumes.
Meanwhile, the 14-day RSI sits around 34, well below the neutral 50 line but still just above classical oversold territory at 30.
That reading confirms that bearish momentum is dominant yet also hints that the market is nearing a zone where previous selloffs have started to exhaust. For a more constructive picture to emerge, traders will want to see RSI climb back above 40 and, crucially, a daily close back over the 20-day SMA, which would open the door for a retest of $3,000 and the $3,200 resistance band.
Ethereum Liquidation Data
Further, liquidation data shows how violently leverage has been reset around Ethereum’s latest move. Over the past 24 hours, roughly $105.18 million in positions have been wiped out, with about $78.97 million in longs liquidated versus $26.21 million in shorts. That skew toward long liquidations confirms that the first leg of the move was driven by aggressive selling, forcing over-leveraged bullish traders out of the market.
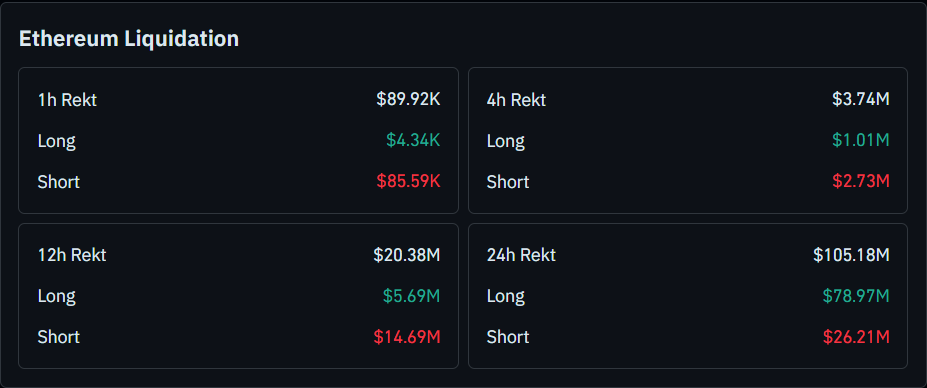
Ethereum Liquidation
However, the intraday picture has started to flip. In the last 12 hours, liquidations total about $20.38 million, with shorts ($14.69 million) notably higher than longs ($5.69 million). Also, the latest 1-hour window shows the same pattern: around $89.92K in liquidations, of which $85.59K are shorts. Even on the 4-hour view, shorts at $2.73 million exceed longs at $1.01 million.
This shift suggests that, after the initial long flush, the subsequent bounce toward $2,800 has started to squeeze late bearish positions, hinting at a short-term attempt to stabilize price above key support while the broader downtrend and heavy 24-hour long liquidations still cap upside momentum.