
Ethereum is consolidating around key support levels, with potential for upward momentum if it maintains current support and overcomes resistance.
For context, Ethereum (ETH) is currently trading at $3,134, reflecting a modest 0.5% increase over the past 24 hours. The price has fluctuated between $3,071 and $3,141, indicating a relatively narrow daily range. It also suggests some consolidation around the $3,100 level, which could indicate that Ethereum is building a base for a potential continuation of its upward momentum.
Looking at Ethereum’s broader performance, it has shown a 2.5% decrease over the past week due to a brief pullback. However, it has also gained 5.5% over the last 14 days, indicating a more positive medium-term outlook.
Should the upward momentum persist, Ethereum could be poised to challenge the $3,160 resistance level again. However, maintaining its position above the $3,100 support zone will be crucial for continued bullish prospects.
Where’s Ethereum Price Headed?
Notably, Ethereum is currently navigating within a consolidation phase, with price action fluctuating between the upper Bollinger Band at $3,276.54 and the lower band at $2,852.52.
Ethereum Price Analysis
The $3,200 area has proven to be a critical resistance zone, where ETH has faced repeated challenges. The midline of the Bollinger Bands, sitting near $3,064, is acting as a dynamic support level, which suggests that Ethereum is trading in a relatively stable channel as long as this level holds.
On the downside, $2,940 and $2,852 represent key support zones. A break below these levels could trigger a deeper retracement towards $2,700 and potentially even $2,600.
Meanwhile, the Stochastic RSI is near the oversold area, with a value of 29.65. At this point, unless the blue line crosses above the orange line, and the RSI crosses above the 50 mark, there may not be enough momentum to push Ethereum higher in the short term.
Ethereum Open Interest
A separate chart from CoinGlass highlights the relationship between Ethereum’s price and the Open Interest-Weighted Funding Rate over time. ETH’s price showed recent fluctuations around the $3,121 mark, while the OI-Weighted indicator showed a positive reading at 0.0074%.
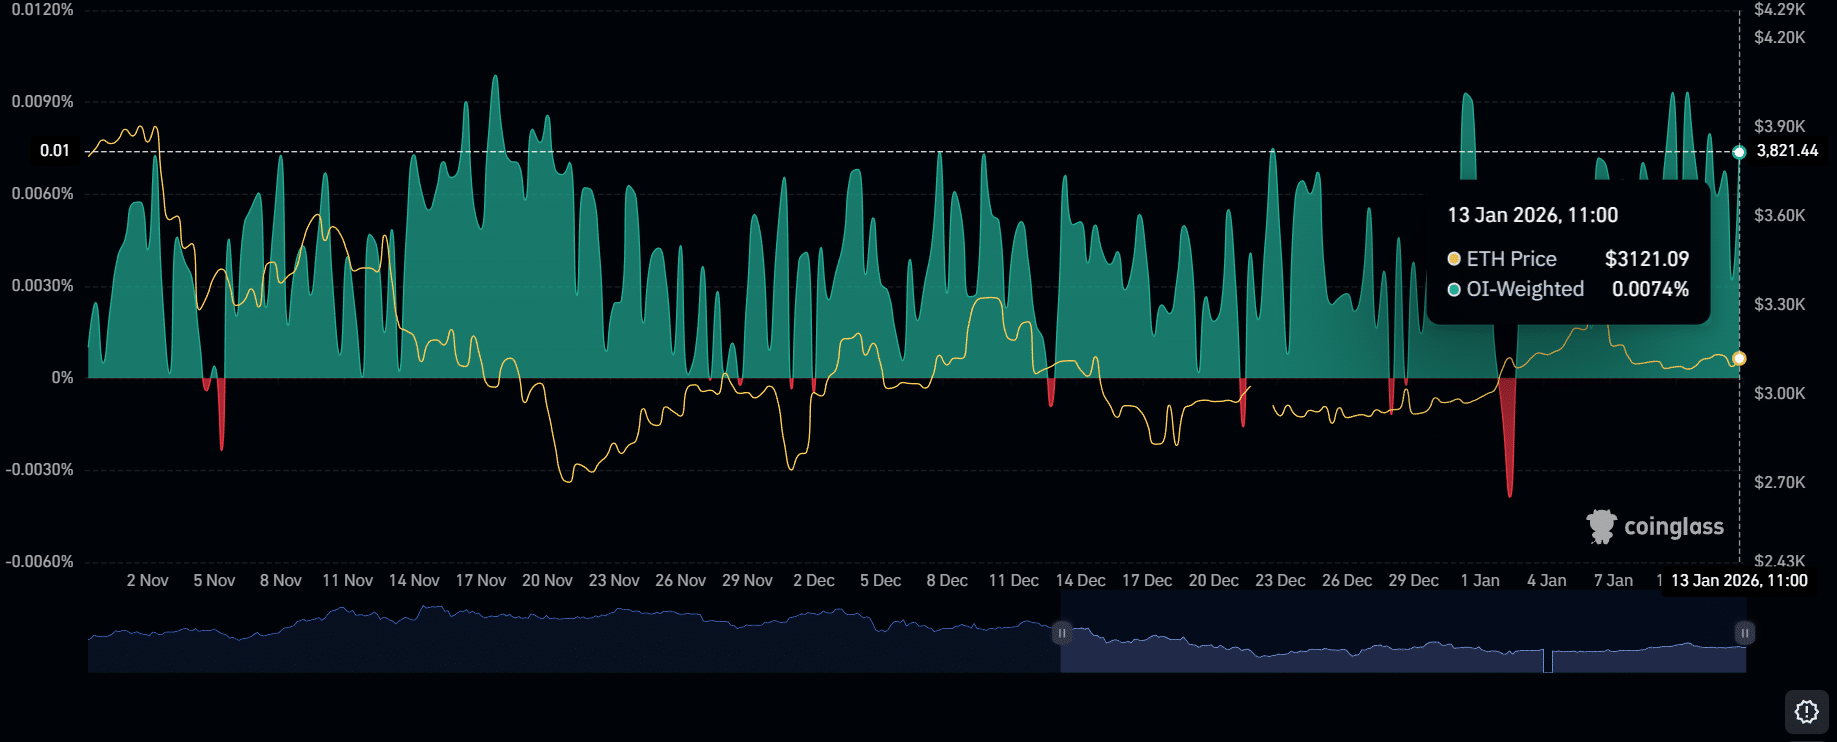
Ethereum OI Weighted Funding Rate
The OI-Weighted indicator tracks the influence of open interest on price movements, with higher readings indicating stronger market participation. Notably, the chart reveals an uptick in OI recently, which suggests growing investor confidence and liquidity.
The chart also shows a marked divergence between price and OI-Weighted in early December 2025 and again in early January 2026. This divergence could indicate a potential shift in market sentiment, with OI-Weighted increasing during price corrections. This could signal accumulation or a buildup for a larger price movement.