[ad_1]
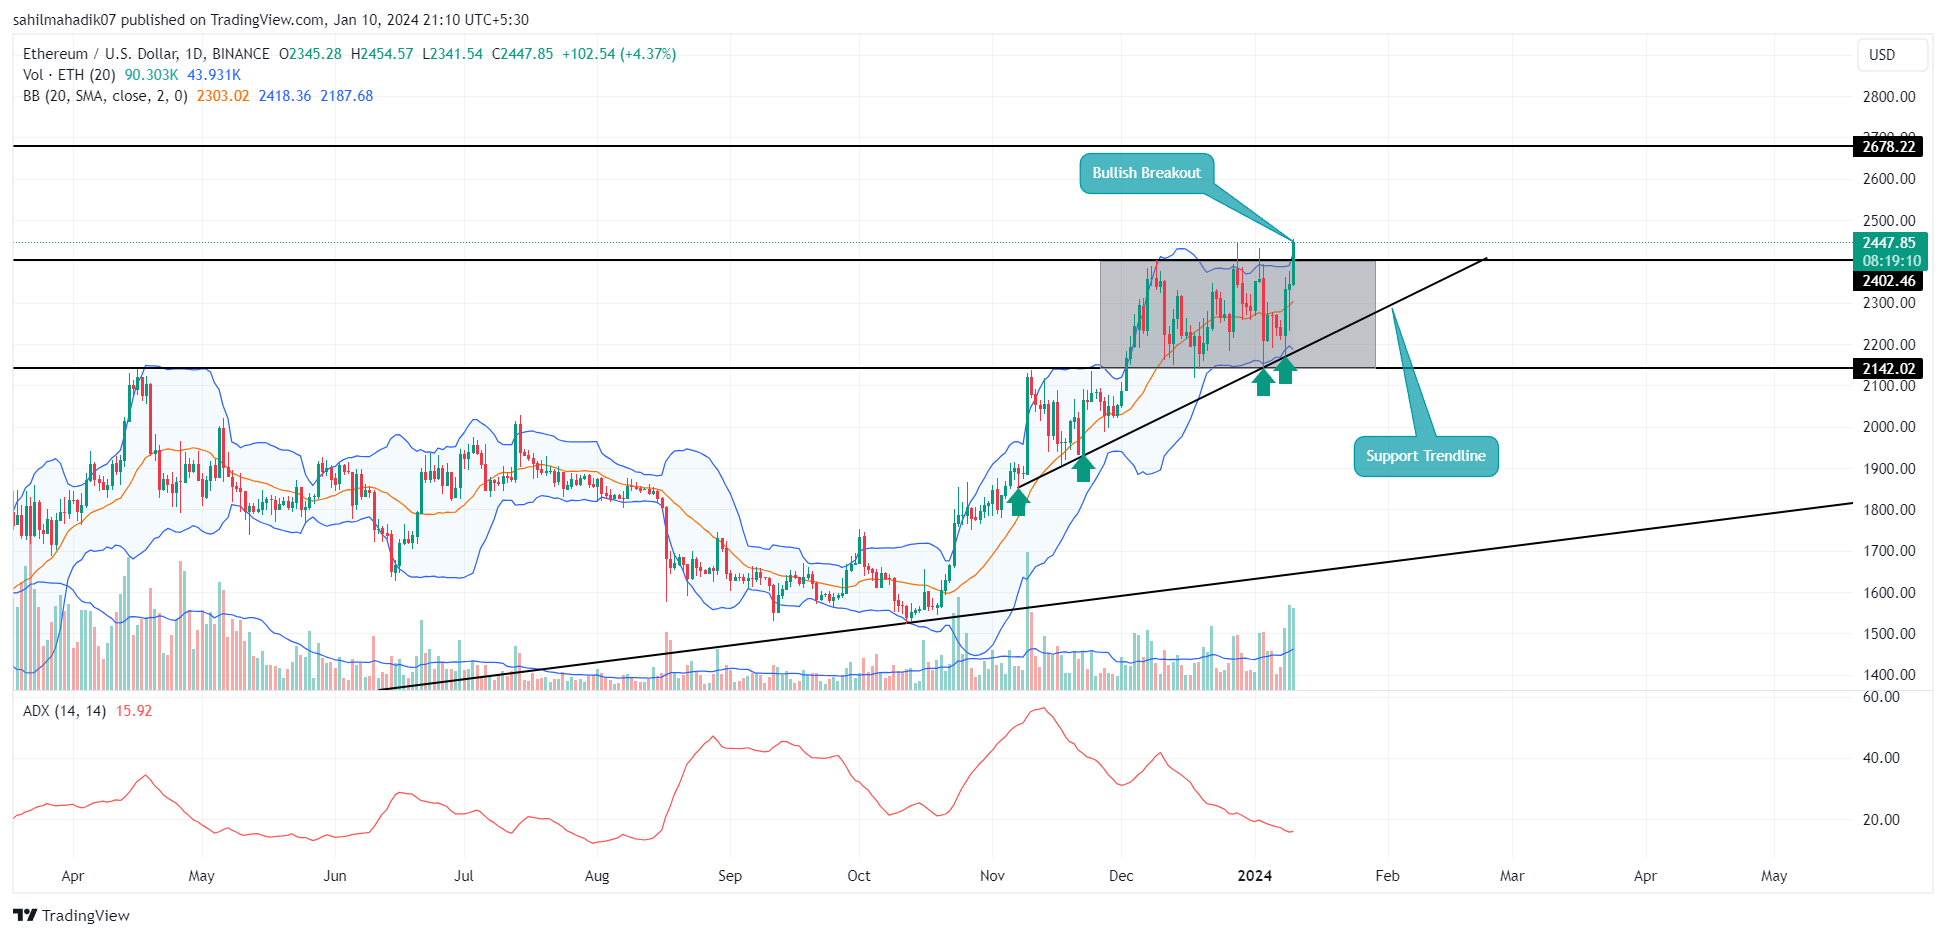
Ethereum Price Prediction: Ethereum, the second-largest cryptocurrency, currently shows a lack of bullish momentum contrary to the generally bullish sentiment around Bitcoin spot ETFs. The ETH price has been resonating between the $2400 and $2140 horizontal levels for the past five weeks, with the overhead supply preventing the buyers from a higher rally. Will potential approval from the US SEC bolster the Ether price to escape this uncertainty?
$2400 Breakout Will Trigger a Direction Rally
- A steep support trendline leads to the current recovery trend in the ETH price.
- A potential recovery may face new resistances at $2680 and $3000
- The intraday trading volume in Ether is $20.8 Billion, indicating a 68% gain.

Ethereum Price Prediction| TradingView Chart
An ascending trendline in the daily time frame chart shows the Ethereum price recovery is intact and the current sideways trend is likely a post-rally consolidation to recuperate the exhausted bullish momentum.
Interestingly, the Ethereum whales have accumulated nearly $1 billion worth of Ether despite its underperformance relative to Bitcoin. A recent tweet from renowned crypto analyst Ali Martinez reveals that the Ethereum smart money has significantly increased its holdings by accumulating more than 410,000 ETH tokens during the past month(December).
This accumulation amid the crypto market’s progress towards the first spot Bitcoin ETF hints the ETH may also witness a major impact of US SEC approval as the potential for spot Ethereum ETF will also accelerate.
By press time, the ETH price shows a 3.77% jump and teases a bullish breakout from the $2400 resistance level. If buyers succeed in closing a daily candle above this barrier, it could lay a solid foundation for additional upward movement.
Such a breakout could potentially result in a 10% rise in ETH, setting its next target at around $2,680. Following this, a prolonged recovery could target the $3,000 and $3280 mark.
This Support Prevents ETH From Major Correction
Over the past two months, the ETH price has been receiving dynamic support from an ascending trendline. The coin price rebounded several times from this support indicating the buyers are actively accumulating at a dip which is a key sign of sustainable recovery. Thus, it also indicates losing this support could intensify selling pressure and trigger a new correction in this asset.
- Bollinger Band: An uptick in the upper boundary of the Bollinger band indicator suggests the bullish momentum is strengthening.
- Average Directional Index: A low value of ADX(15%) hints the ongoing consolidation has managed to offer buyers sufficient break to kickstart a new rally.
Related Articles:
- Crypto Price Prediction For January 10 as Fake BTC ETF News Surged Market Volatility: ETH, ARB, LDO
- Spot Bitcoin ETFs Preparing To Commence Trading On Thursday Morning
- US SEC Faces Massive Backlash Over Fake Spot Bitcoin ETF ‘Approval’ Post
[ad_2]

