Ripple’s native token XRP has gained massive attention from crypto enthusiasts due to its impressive upside rally over the past few days. On November 24, 2024, a whale transaction tracker, Whale Alert, posted on X (formerly Twitter), signaling every investor and trader that this rally might be nearing its end.
XRP Whale Move 20 Million Tokens to Upbit
The post on X noted that an XRP Whale had dumped 20 million tokens worth $27.24 million on Bybit, South Korea’s largest crypto exchange. However, this massive dump occurred during a period when the overall cryptocurrency market was in a correction phase, and XRP itself was struggling.
🚨 🚨 20,000,000 #XRP (27,244,343 USD) transferred from unknown wallet to #Bybithttps://t.co/mb7q3SbRYt
— Whale Alert (@whale_alert) November 24, 2024
Following this dump on the centralized exchange (CEX), XRP’s daily chart appears bearish, suggesting its price could face a significant correction.
XRP Technical Analysis and Upcoming Level
According to expert technical analysis, XRP appears to be forming a bearish evening star candlestick pattern near the breakout level of $1.40. Based on recent price action, if the altcoin successfully forms this candlestick pattern and closes the daily candle below the $1.30 level, it could drop by 20% to reach $1.05 in the coming days.
Source: Trading View
However, XRP has experienced a parabolic move, and to sustain this momentum in the coming days, the asset might need to undergo a correction or a period of price consolidation.
Currently, the altcoin is trading above the 200 Exponential Moving Average (EMA) on the daily timeframe, indicating an uptrend. However, its Relative Strength Index (RSI) suggests limited room for further rally, as its value has been above 80 since November 11, 2024, indicating that the asset is in overbought territory.
Traders Sentiment: Bullish or Bearish
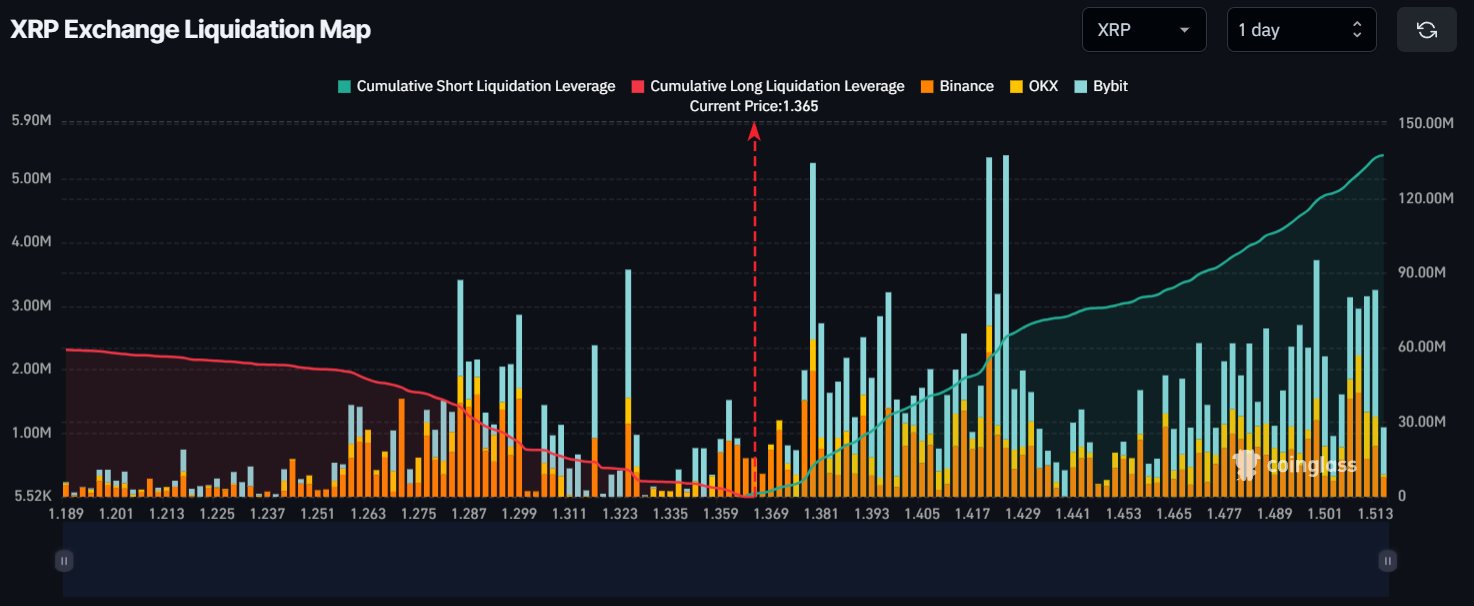
Aside from whale activity, readers may wonder what traders are currently up to. Data from the on-chain analytics firm Coinglass suggests that traders are over-leveraged, with key levels at $1.325 on the lower side and $1.379 on the upper side.
Coinglass’s exchange liquidation map further indicates that traders have held $10.76 million worth of long positions at the lower level, while $12.41 million worth of short positions are concentrated at the upper level.

Source: Coinglass
This liquidation data indicates that sell-side traders are comparatively higher, which could lead to a price decline in the coming days.
Current Price Momentum
At press time, XRP is trading near $1.38 and has recorded a price decline of 7.10% in the past 24 hours. During the same period, its trading volume dropped by 30%, indicating lower participation from traders and investors compared to the previous day.

