The Ethereum (ETH) price has moved slowly relative to Bitcoin (BTC) for nearly 500 days.
The Relative Strength Index (RSI) just gave a signal that has only been seen twice before.
Ethereum Returns to 1600-Day Support
The Ethereum/Bitcoin (ETH/BTC) chart shows that the ETH price has fallen under a descending resistance trend line (dashed) since September 2022. The downward movement led to a low of ₿0.049 in December 2023.
The low validated a long-term ascending support line for the fourth time (green icons). The Ethereum trend line has been in place for nearly 1,600 days. On the other hand, the resistance trend line has been in place for nearly 500 days.
ETH/BTC Weekly Chart. Source: TradingView
When evaluating market conditions, traders use the RSI as a momentum indicator to determine whether a market is overbought or oversold and whether to accumulate or sell an asset.
If the RSI reading is above 50 and the trend is upward, bulls still have an advantage, but if the reading is below 50, the opposite is true. The weekly RSI has generated a bullish divergence while moving outside its oversold territory.
This has happened only once before, in June – December 2019, and preceded a 400% upward movement.
What Do the Analysts Say?
Cryptocurrency traders and analysts on X believe that ETH will soon bottom against BTC despite the ongoing downtrend.
Bob Loukas tweeted:
Good chance ETH/BTC bottoms in late Jan and is never tested for min 2 yrs.
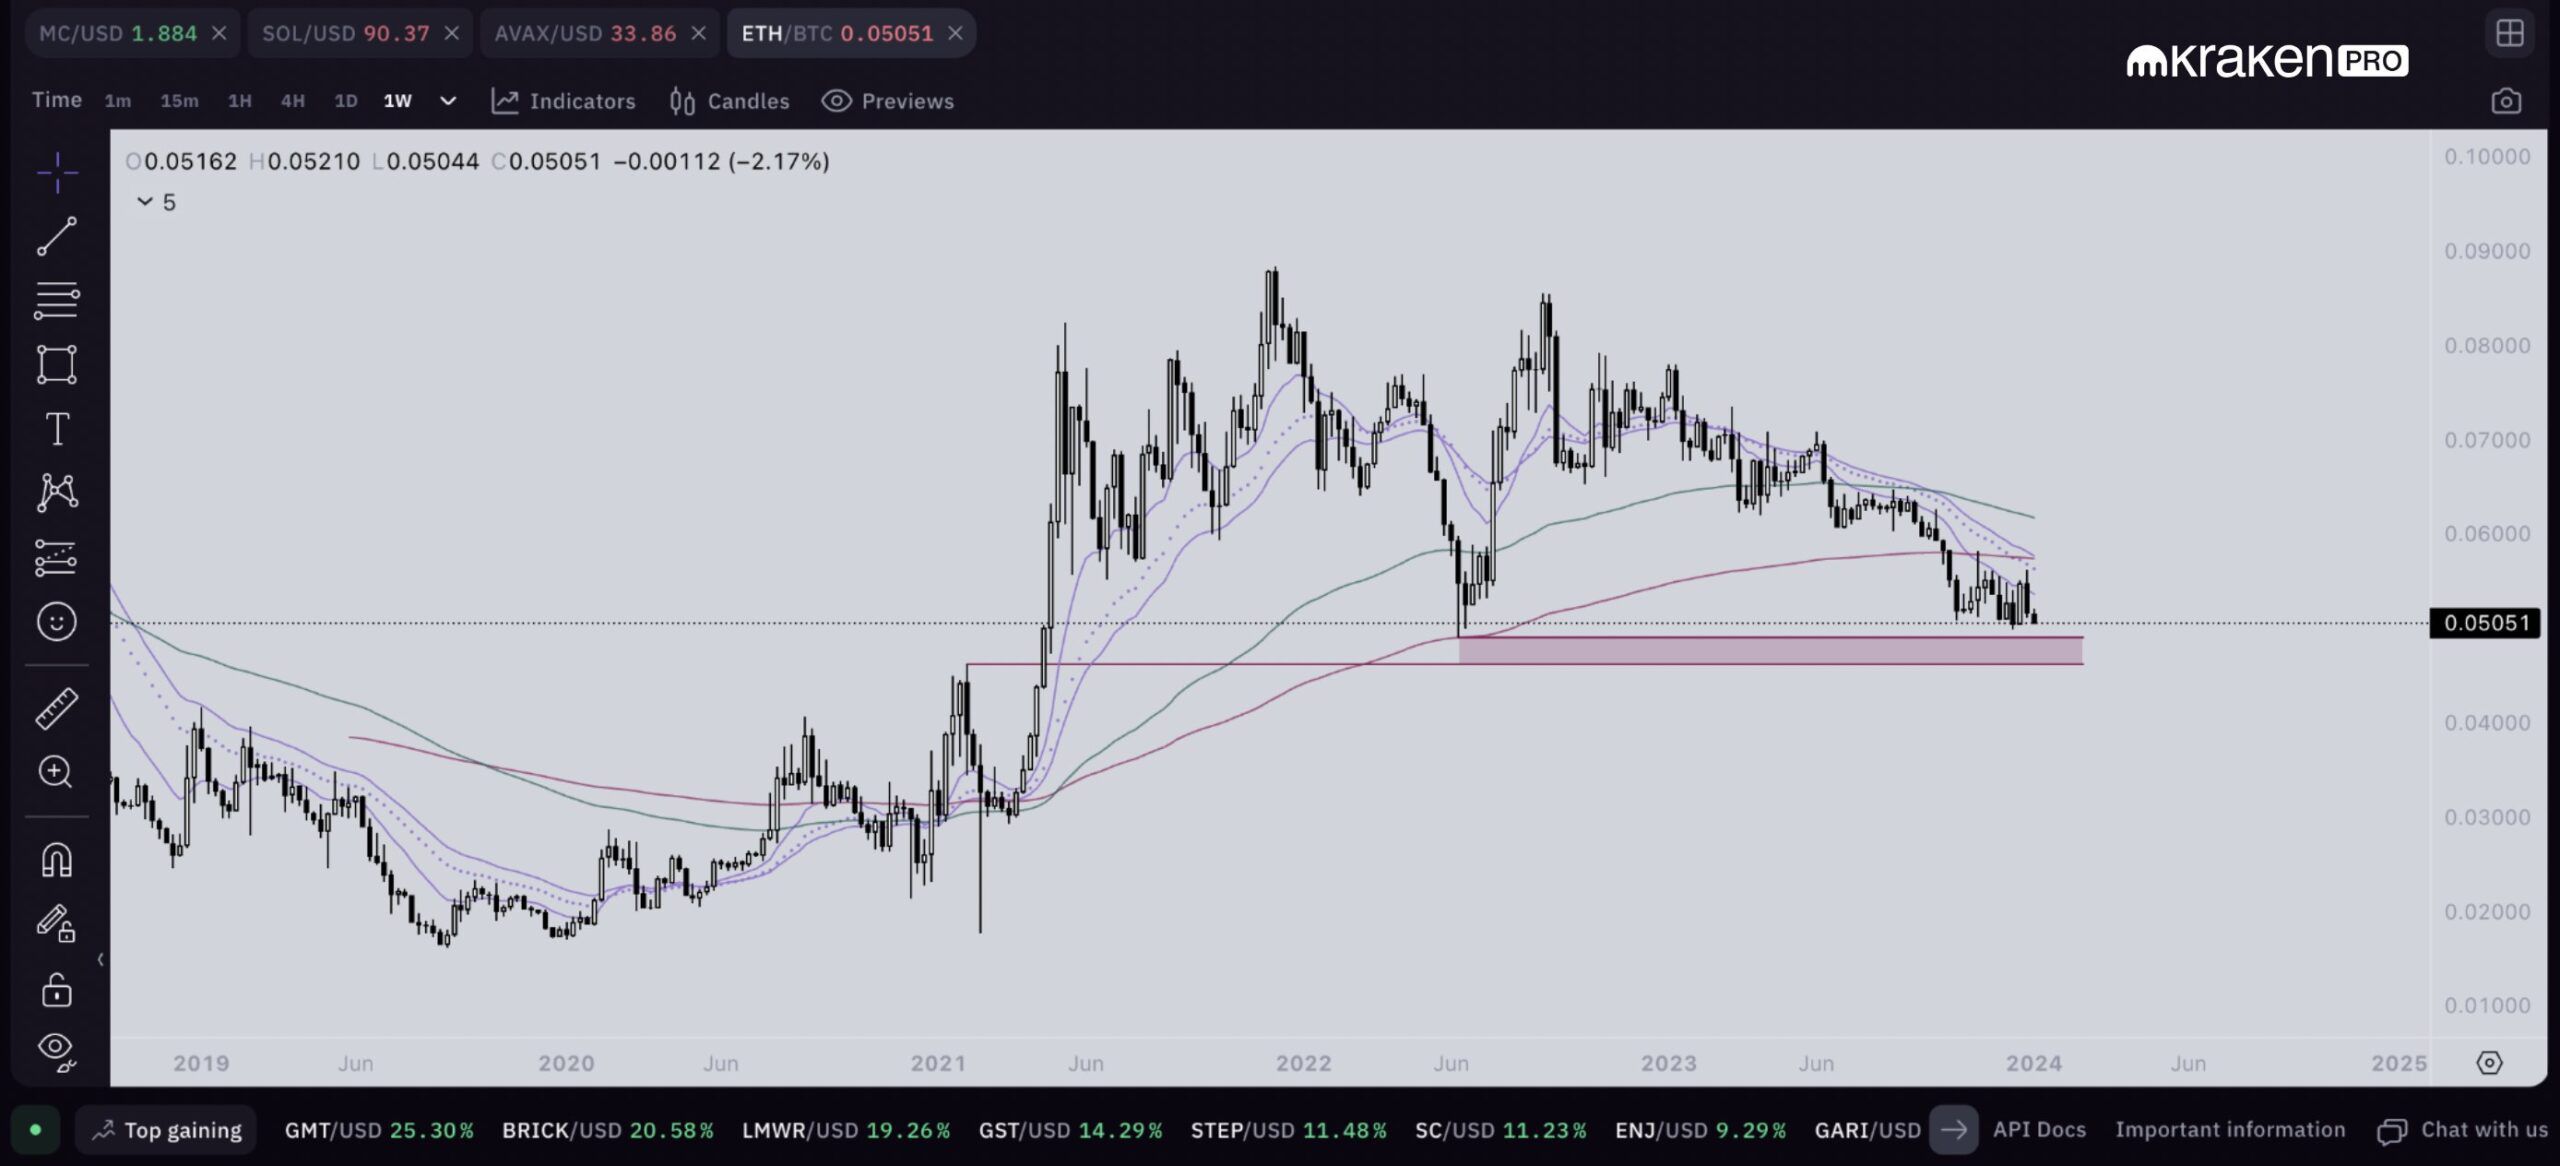
Dentoshi tweeted a chart showing the ETH price approaching a critical support level, noting that the Dencun upgrade will reduce network congestion and Layer-2 fees, helping the price reverse trend.

Ethereum/BTC Weekly Chart. Source: X
Finally, CryptoMichNL suggests the Bitcoin Dominance Rate (BTCD) will reach a top soon. Since Ethereum is the largest altcoin and its movements heavily affect the BTCD, this is inherently bullish for the ETH/BTC pair.
ETH Price Prediction: Is the Bottom Close?
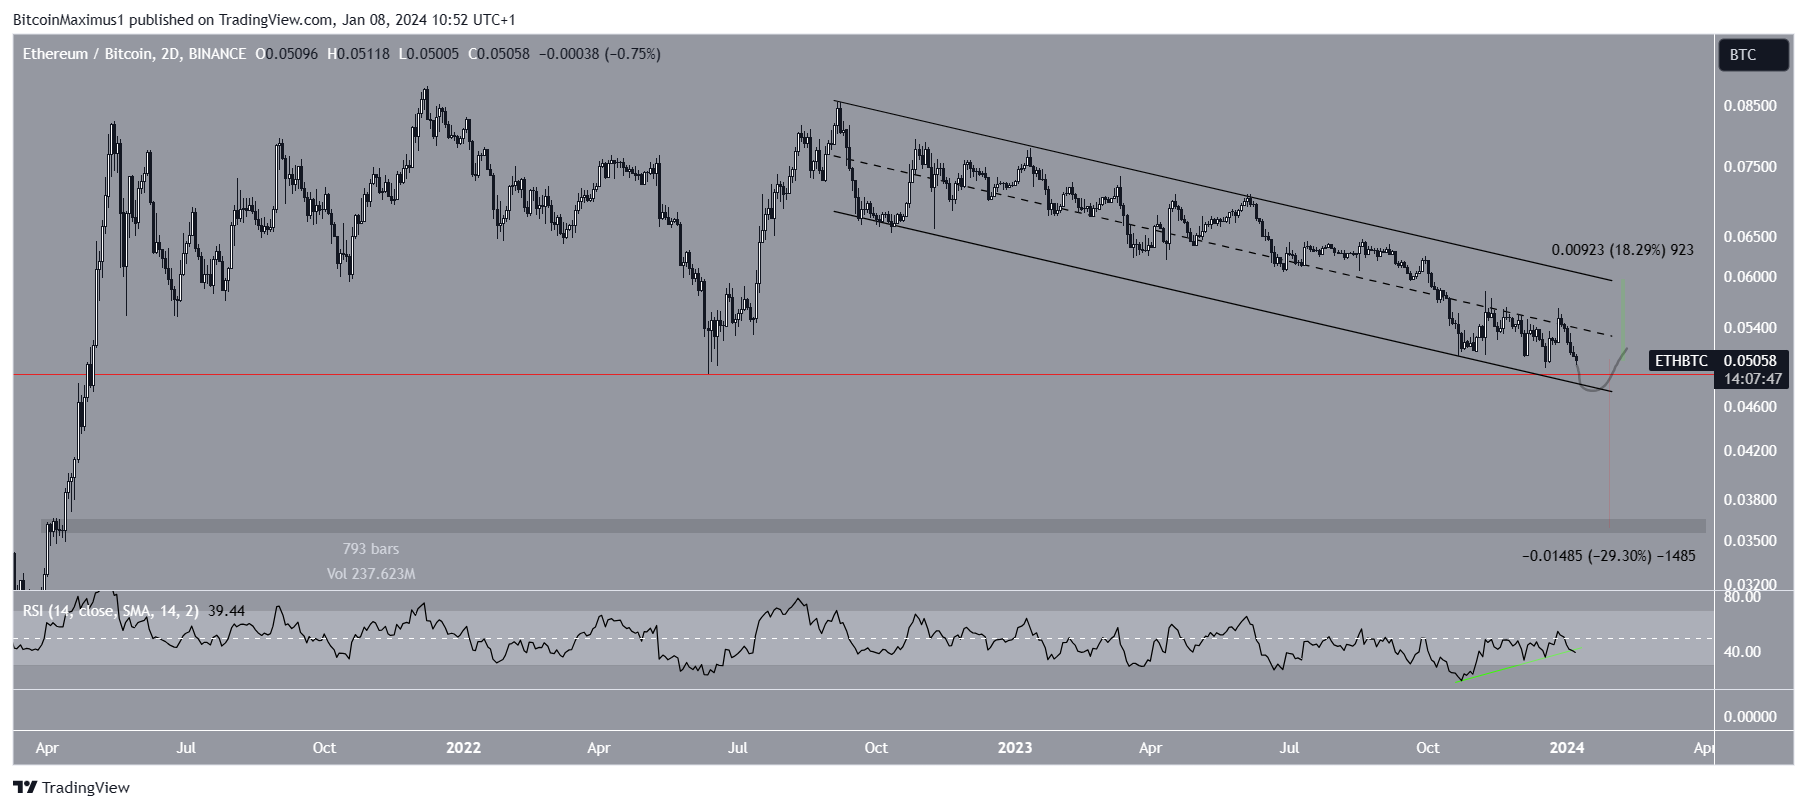
Similarly to the weekly chart, the 2-day one shows bullish signs despite the ongoing downward trend. Firstly, the price has traded inside a descending parallel channel since September 2022.
Such channels usually contain corrective movements. ETH currently trades close to the channel’s support trend line.
Secondly, the RSI has generated significant bullish divergence associated with local and absolute bottoms. The channel’s support trend line is currently at ₿0.048, slightly below the June 2022 low (red) of ₿0.049.
So, the ETH price may deviate below this level, reach the ascending support trend line, and begin upward toward the channel’s resistance at ₿0.060. This would be an increase of nearly 20%, based on the current price.

ETH/BTC 2-Day Chart. Source: TradingView
Despite this bullish ETH price prediction, a breakdown from the channel can cause a 30% drop to the next closest support at ₿0.037.
For BeInCrypto’s latest crypto market analysis, click here.

