Bitcoin price today: $67,000
- Bitcoin bounces off the $66,000 level, with a possible recovery on the cards.
- Glassnode weekly report highlights an increasing presence of institutional investors in the digital asset space.
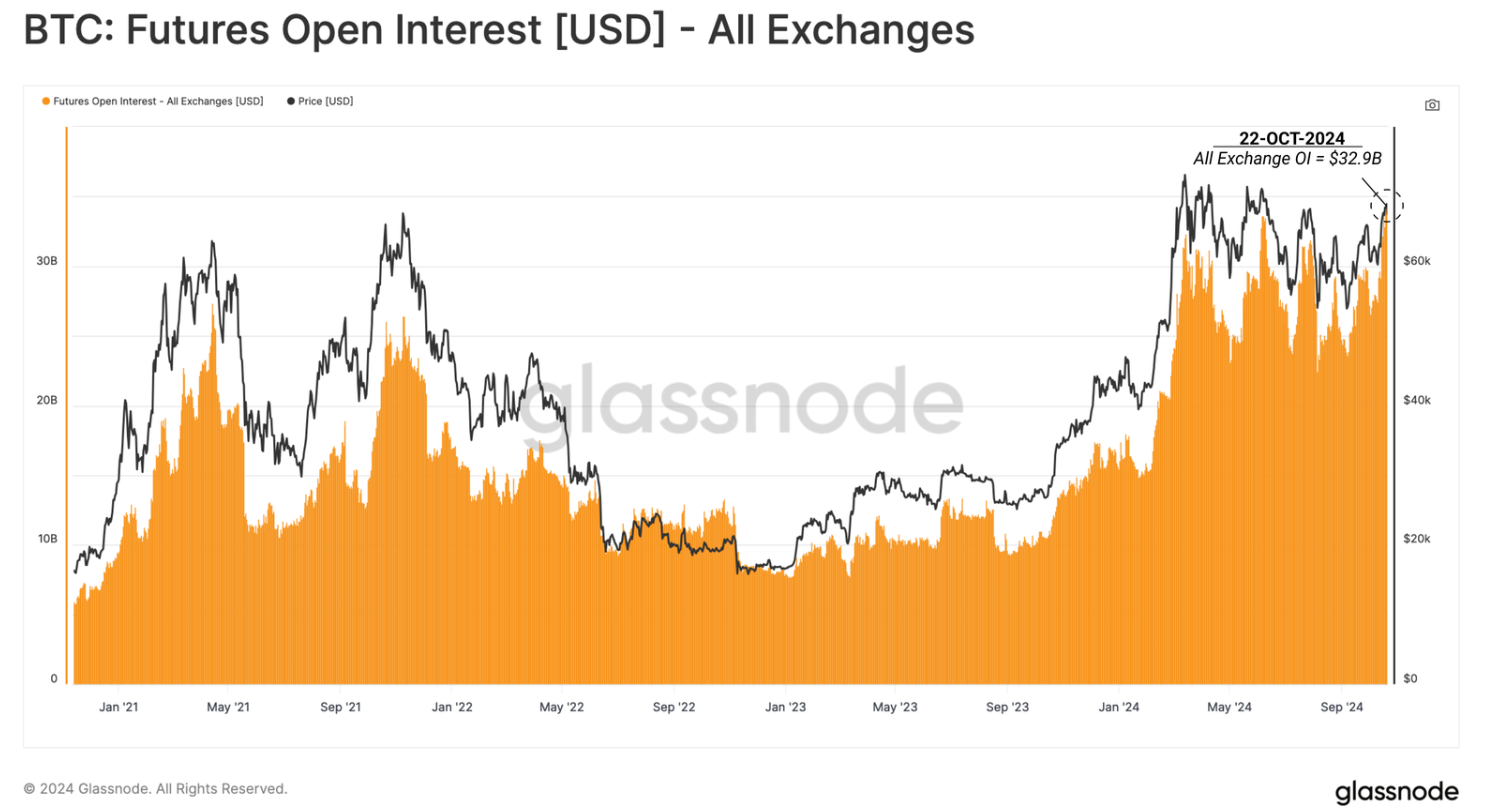
- BTC Futures Open Interest recorded a new ATH of $32.9 billion, indicating an influx of capital.
Bitcoin (BTC) bounced back to trade slightly above $67,000 on Thursday after three consecutive days of decline since Monday. Reports indicate a growing presence of institutional investors in the digital asset space, as evidenced by the new all-time high in Futures Open Interest, which suggests optimism for Bitcoin’s price outlook.
Bitcoin short-term holders keep betting on BTC
Glassnode weekly report highlights the unrealized profits of the short-term holder cohort, a metric that serves as a key indicator of the sentiment among recent buyers in the market.
The spot price trades above the average acquisition price of all short-term holders sub-age groups, as shown in the graph below. This means almost all recent buyers hold an unrealized profit, highlighting the relief that the recent rally has provided to investors.
Bitcoin Realized Price Breakdown for STHs chart. Source: Glassnode
The report also explains that Open Interest (OI) across both perpetual and fixed-term futures contracts has recorded a new all-time high (ATH) of $32.9 billion this week, suggesting a marked increase in aggregate leverage entering the system.

BTC Futures Open Interest chart. Source: Glassnode
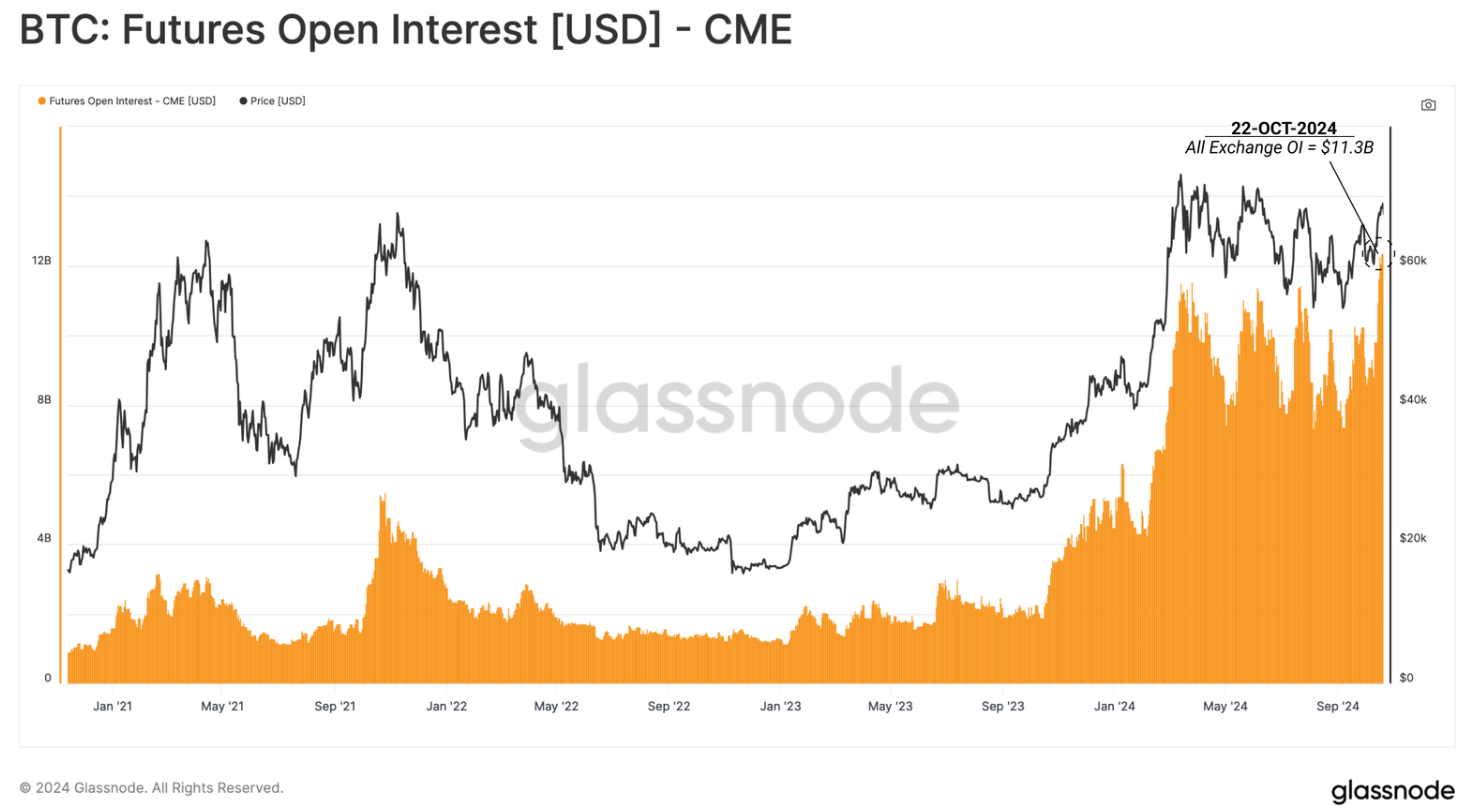
“The dominance of the CME Group exchange highlights an increasing presence of institutional investors in the digital asset space, which strongly indicates that a cash-and-carry strategy is in play,” the report says.

BTC CME chart. Source: Glassnode
Bitcoin Price Forecast: Small bounce
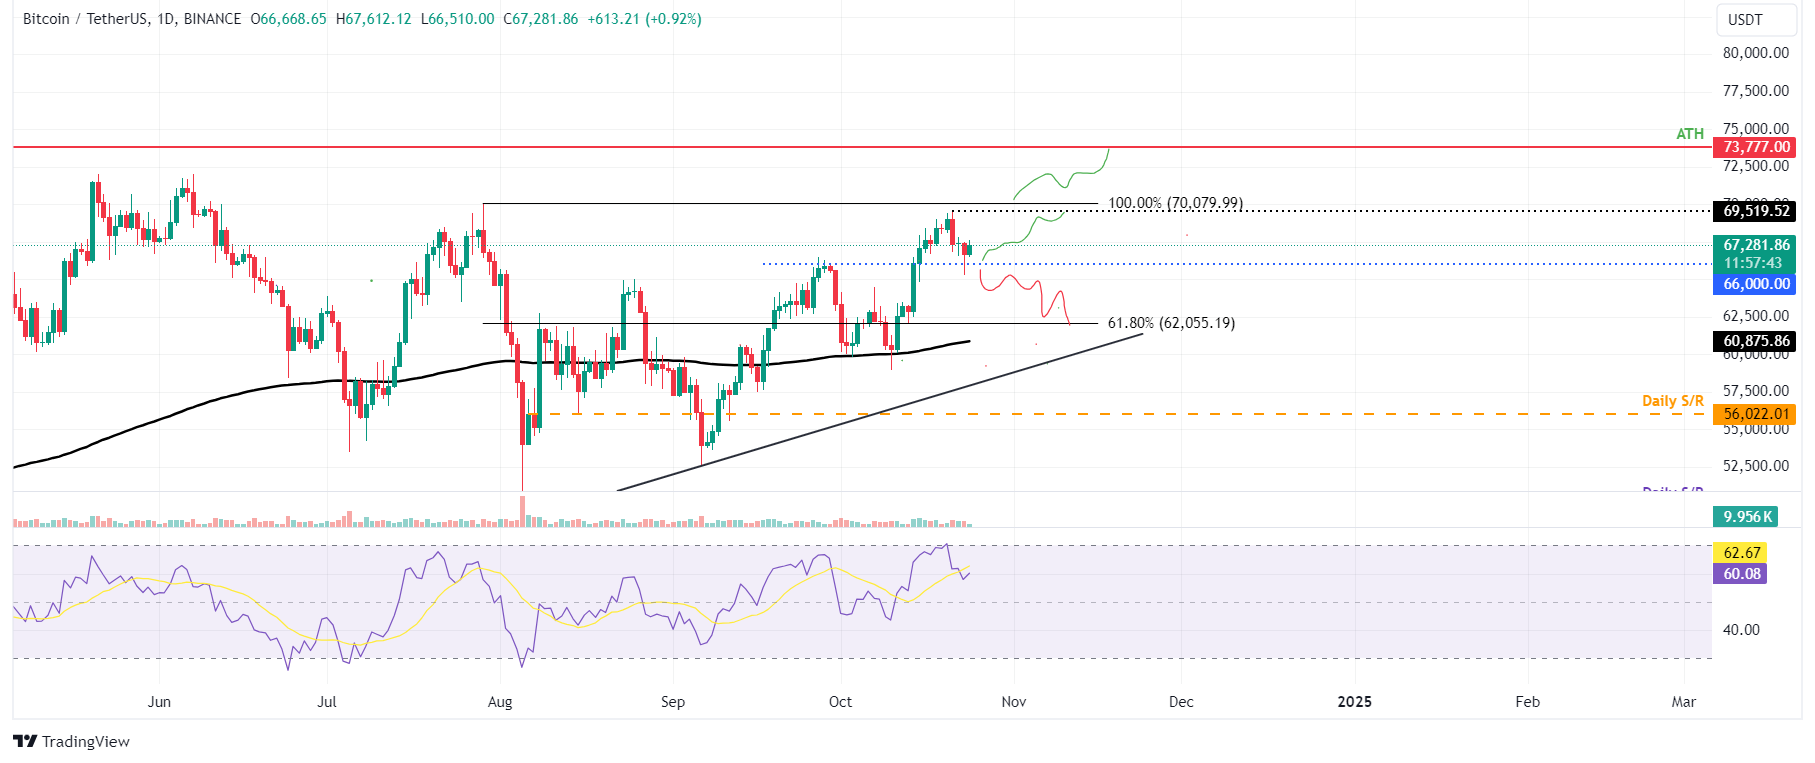
Bitcoin price declined for a third consecutive day on Wednesday, falling below $66,000 and reaching a daily low of $65,260 after encountering resistance near the key psychological level of $70,000 on Monday. However, it rebounded after retesting its support level of $66,000 and is trading slightly above $67,000 on Thursday.
If the $66,000 level holds as support, it could rally to reclaim its Monday high of $69,519.
The Relative Strength Index (RSI) indicator on the daily chart reads 58 and points downwards after rejecting the overbought level of 70, indicating weakness in bullish momentum. If it continues to decline and closes below its neutral level of 50, it could lead to a sharp decline in Bitcoin’s price.

BTC/USDT daily chart
Conversely, if BTC breaks and closes below $66,000 support, it could decline 5.8% to retest its next support at $62,055, its 61.8% Fibonacci retracement level (drawn from July’s high of $70,079 to August’s low of $49,072).

