
Bitcoin traded at $84,068 on April 20, 2025, with a market capitalization of $1.66 trillion, a 24-hour trading volume of $12.23 billion, and an intraday price range between $84,037 and $85,470.
Bitcoin
The daily chart signals a potential bullish reversal following a sharp correction that drove bitcoin to a low of $74,434 before rebounding to current levels just under $85,000. A series of green candles accompanied by elevated trading volume near the lows suggests possible capitulation and renewed interest from buyers. Key support is forming between $82,000 and $83,000, which traders may look to as a swing trade entry if another pullback occurs. However, resistance remains strong between $87,500 and $88,000, a region that capped the previous rally and is likely to attract profit-taking.
BTC/USD 1D chart via Bitstamp on April 20, 2025.
Short-term dynamics on the four-hour chart reveal developing bearish momentum, with lower highs and multiple red candles indicating a potential downside continuation. The recent bounce off $83,102 lacks conviction, and unless buying volume increases, bitcoin may retest the $83,000 support level. Should this level break, traders could target $81,000 to $80,000 on the downside. Conversely, if support holds, a rebound toward $85,000 is plausible, albeit within a weakening trend structure.
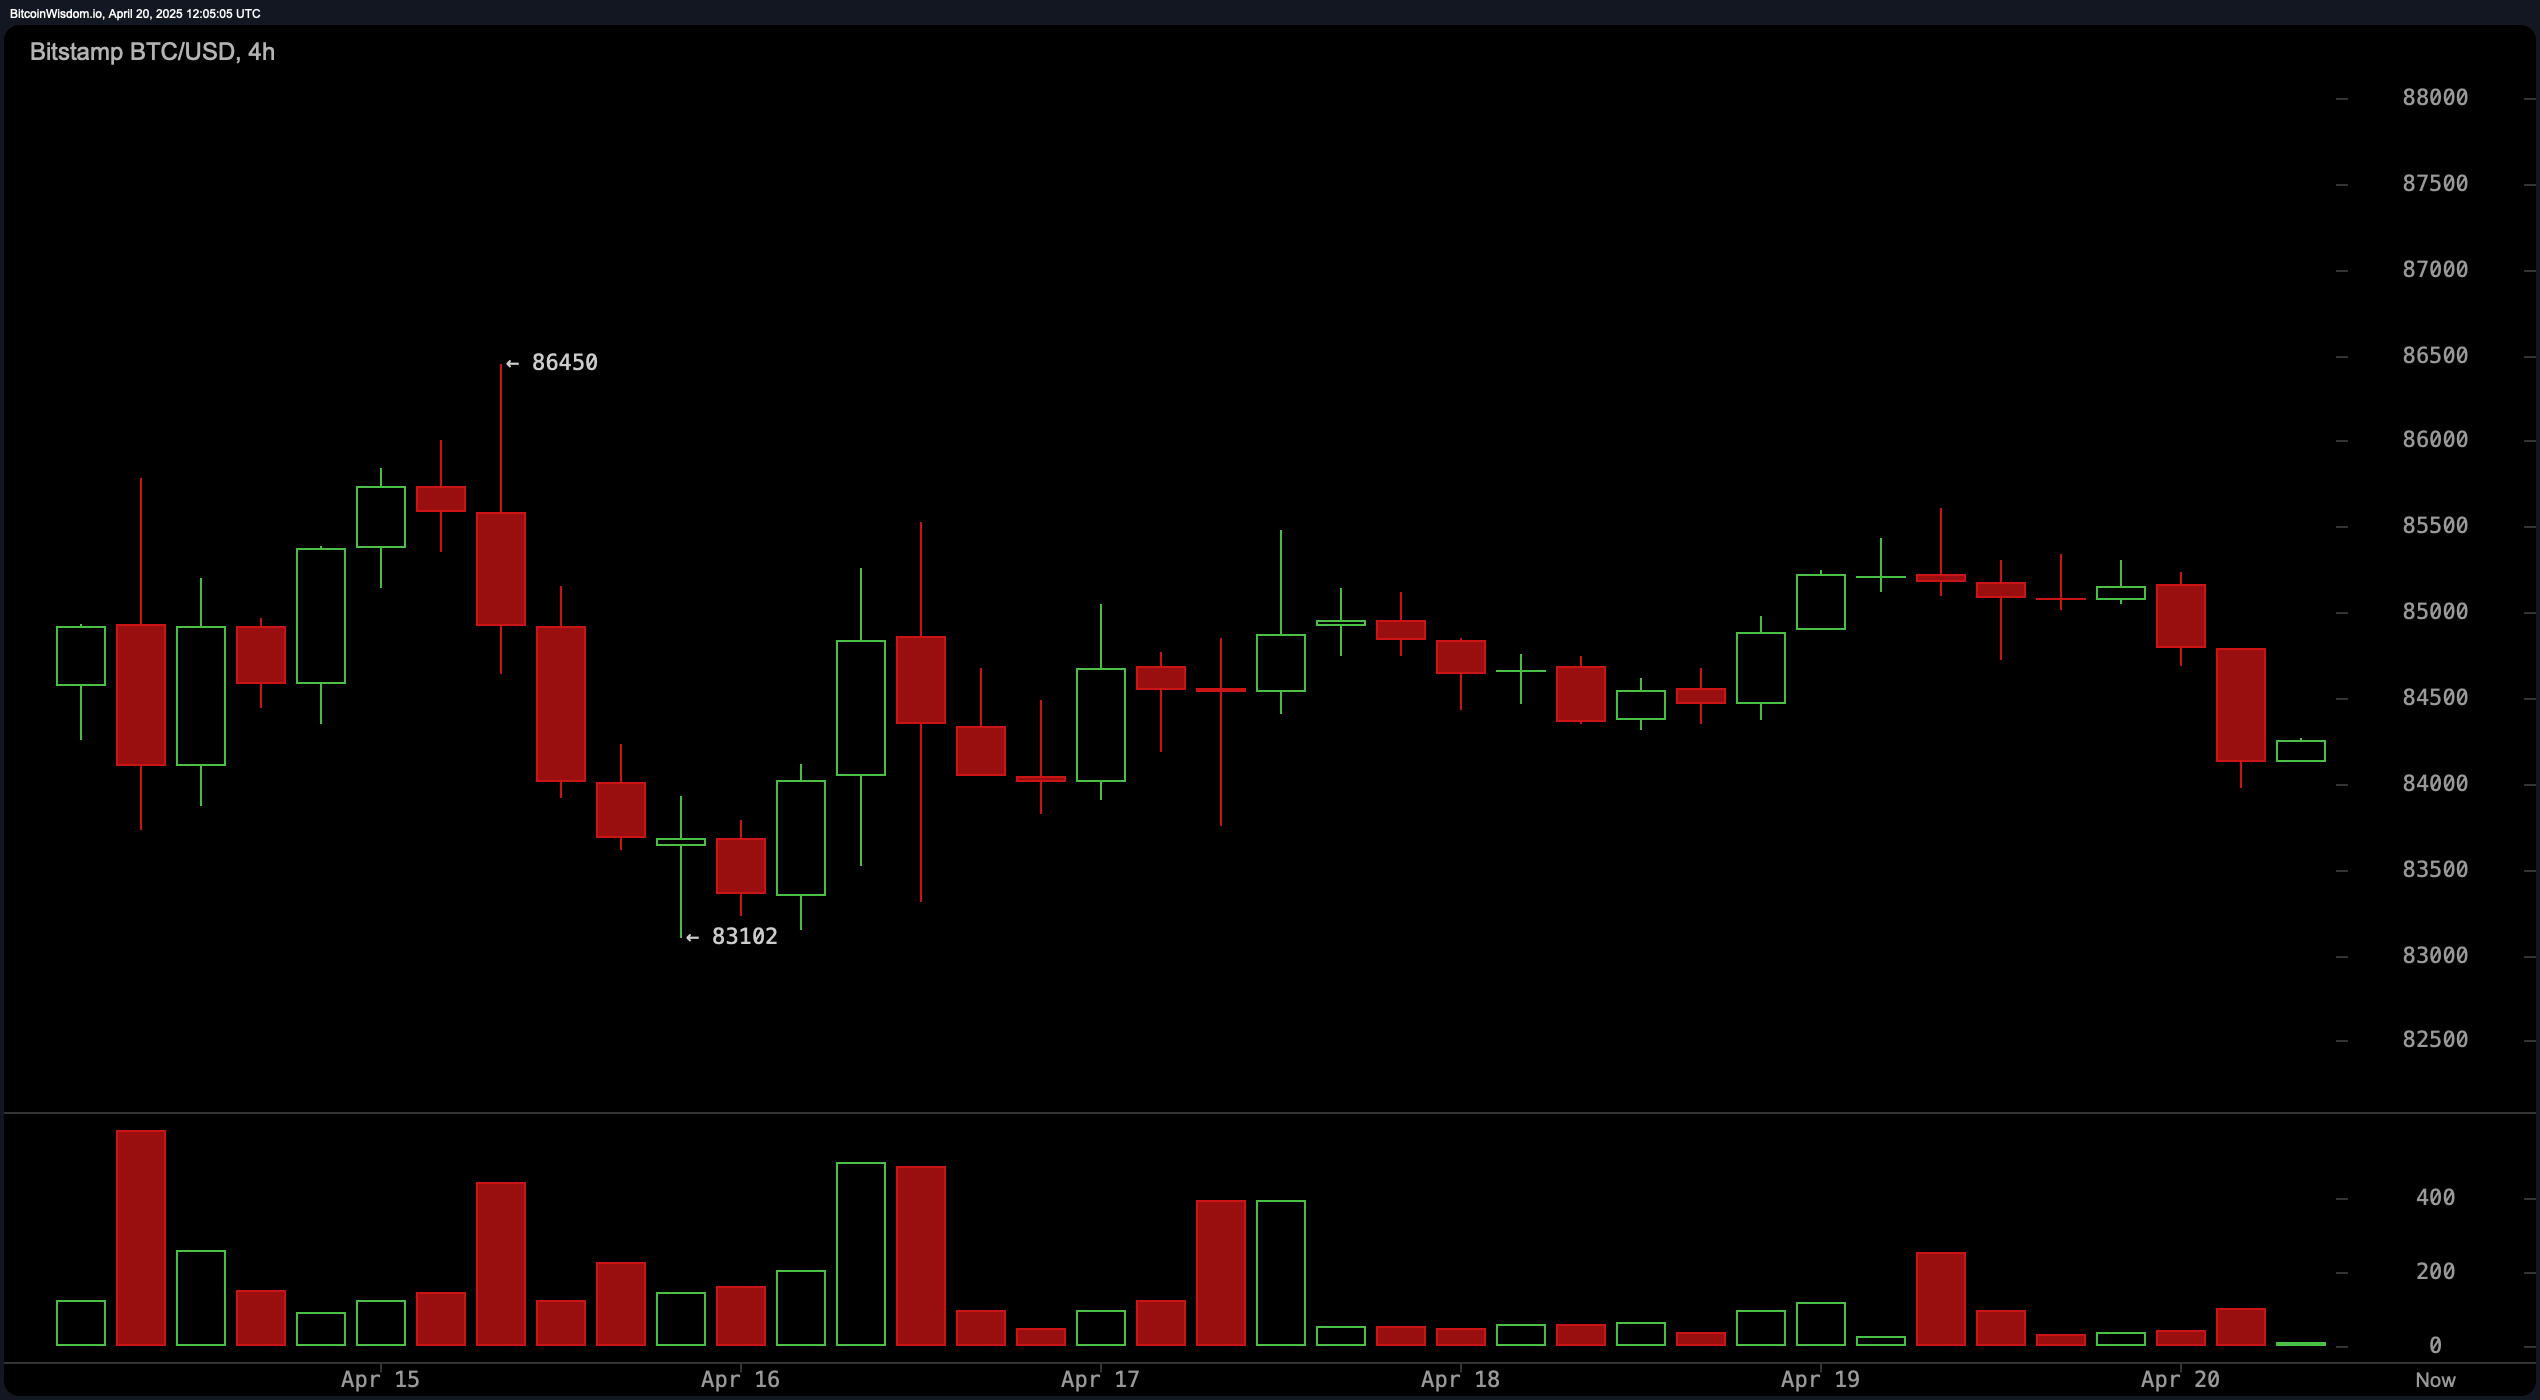
BTC/USD 4H chart via Bitstamp on April 20, 2025.
On the one-hour chart, bitcoin displays a descending price pattern with consistent lower highs, reflecting persistent intraday selling pressure. A weak bounce off $83,974, marked by low volume, does not yet qualify as a strong reversal signal. Scalpers may consider short positions between $84,500 and $85,000, with tight stops above $85,600 and downside targets around $83,500, should bearish momentum confirm.
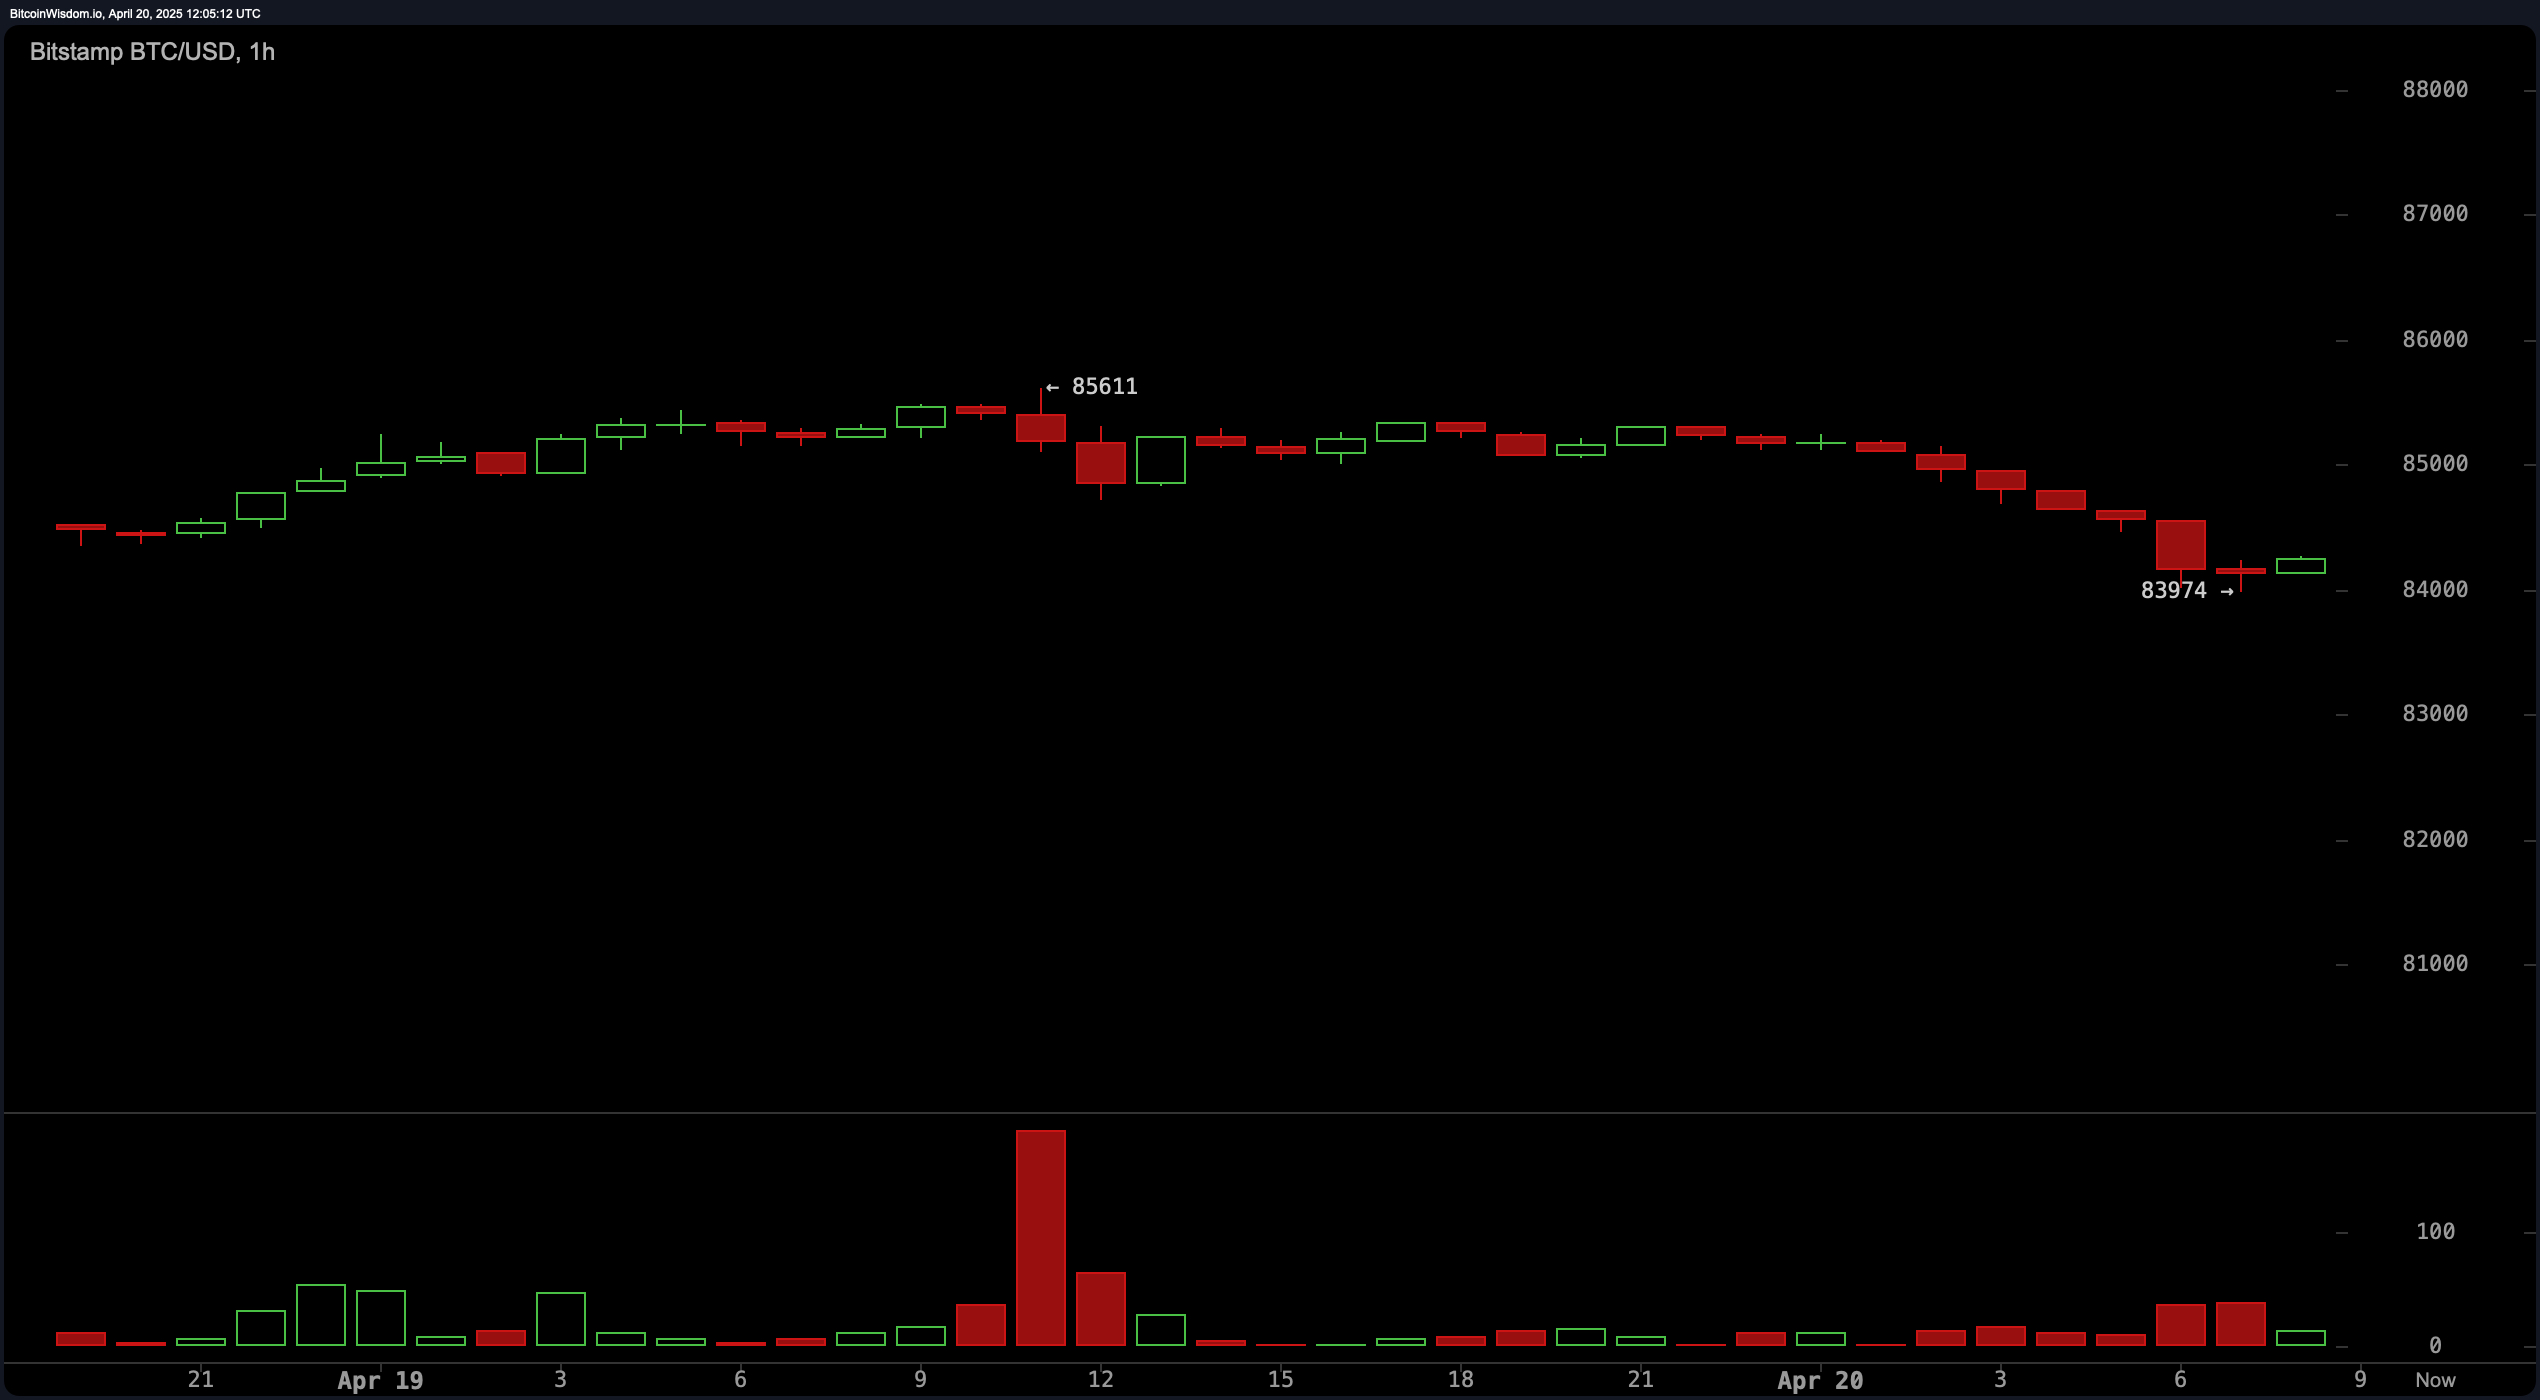
BTC/USD 1H chart via Bitstamp on April 20, 2025.
Oscillator readings reinforce the mixed technical picture. The relative strength index (RSI), Stochastic, commodity channel index (CCI), average directional index (ADX), and awesome oscillator all register neutral, indicating indecision in momentum. However, the momentum indicator and the moving average convergence divergence (MACD) both flash bullish signals, suggesting some underlying positive energy remains intact despite prevailing uncertainty.
Moving averages offer a nuanced view, with shorter-term exponential moving averages (EMAs) and simple moving averages (SMAs) generally supportive of the price, while longer-term averages lean bearish. Specifically, the exponential moving averages for 10, 20, and 30 periods are all issuing positive signals, alongside the simple moving averages for 20 and 30 periods. However, all moving averages from the 50-period onward, including the 100 and 200-period EMAs and SMAs, are in bearish territory. This divergence highlights a critical inflection point where short-term bullishness confronts long-term resistance, requiring traders to weigh momentum carefully before positioning.
Bull Verdict:
If the $82,000–$83,000 support zone continues to attract buying interest and momentum indicators maintain their current trajectory, bitcoin may be poised for another push toward $87,000–$88,000. While long-term moving averages still lean bearish, the short-term recovery and positive signals from the momentum and moving average convergence divergence (MACD) indicators give the bulls a strategic advantage—at least for now.
Bear Verdict:
Despite holding above $84,000, bitcoin faces mounting pressure from declining intraday momentum, a weakening bounce structure, and a majority of medium- to long-term moving averages flashing sell signals. Unless the price breaks decisively above $85,500 with strong volume, the bearish outlook toward $81,000 remains the more probable scenario in the near term.