[ad_1]
Bitcoin’s price is teasing investors, as it is experiencing a pullback before reaching the $100K mark. Yet, as things stand, there’s a considerable probability that it will hit the milestone soon.
Technical Analysis
By Edris Derakhshi (TradingRage)
The Daily Chart
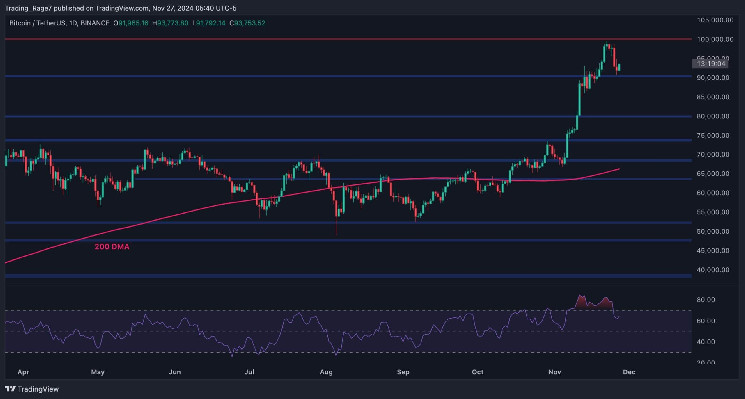
Starting with technical analysis, the daily timeframe shows massive bullish momentum for BTC. Yet, the market has been correcting for the last few days after failing to reach the $100K level.
The $90K mark is still intact and could prevent the market from dropping any further. This is especially true because the RSI is no longer showing an overbought signal.
The 4-Hour Chart
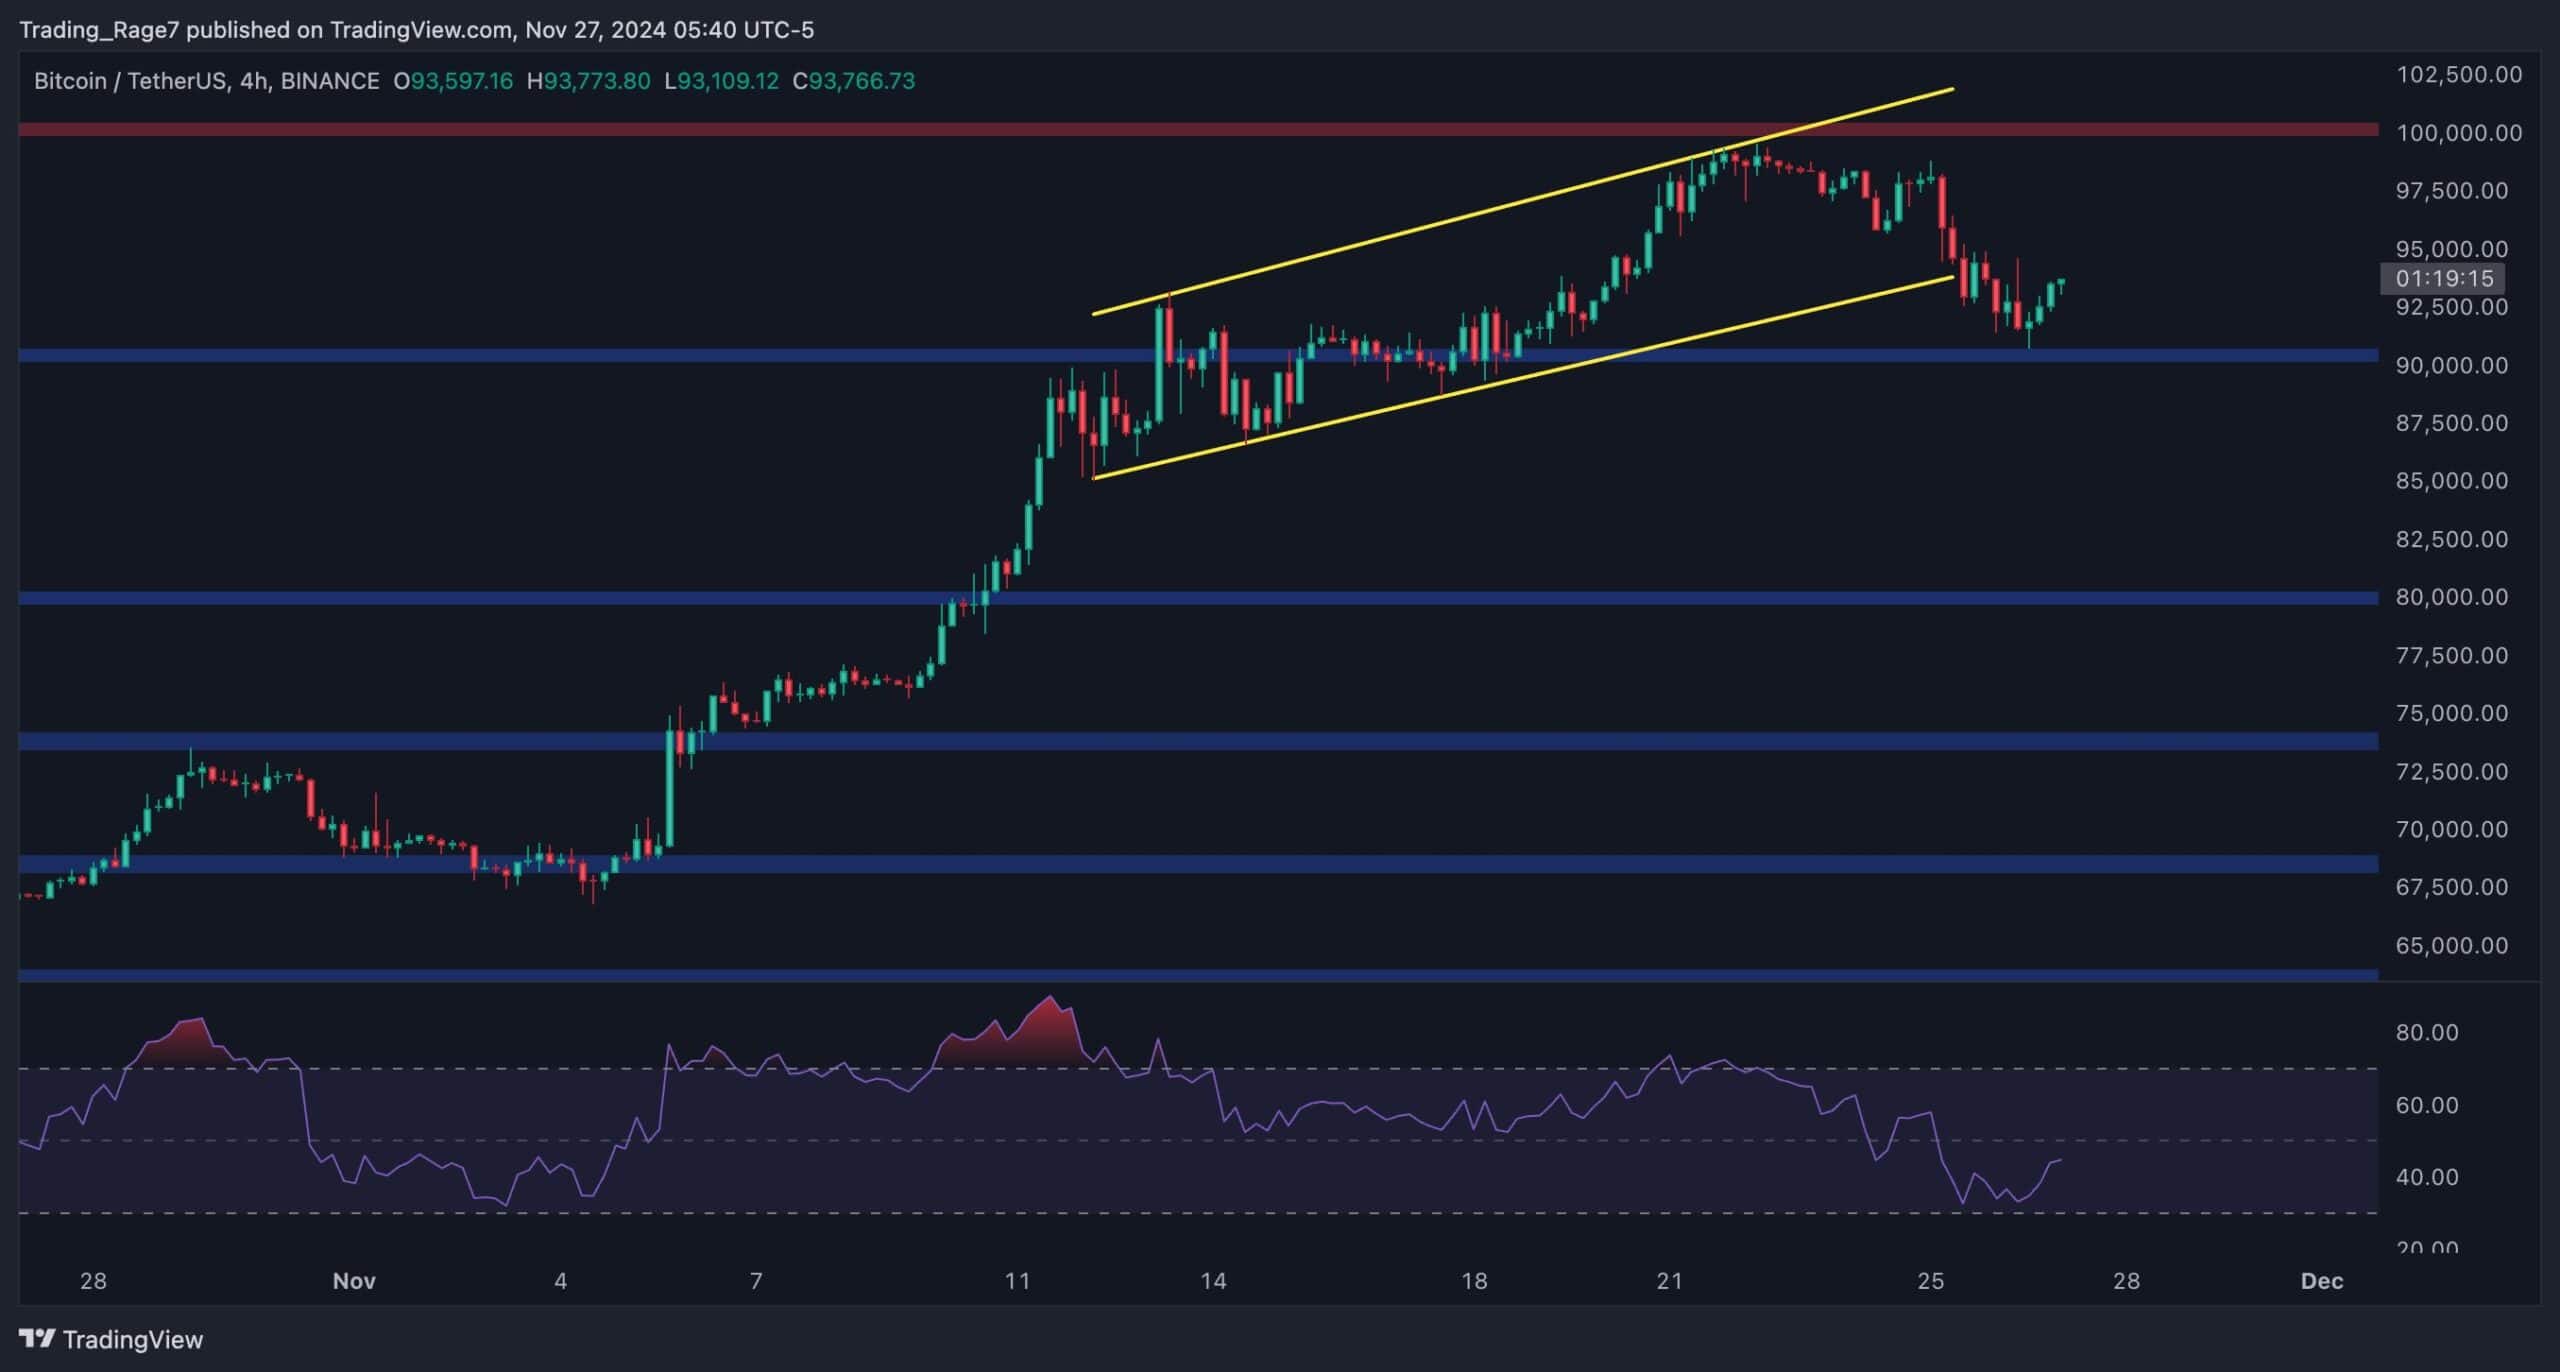
As the 4-hour chart depicts, the recent Bitcoin price action shows the formation of an ascending channel broken to the downside yesterday. This is often a clear reversal pattern.
Yet, as the overall market structure remains bullish, the price can climb back into the pattern soon, making it fail and paving the way for another push toward $100K.
On the other hand, while unlikely, a breakdown of the $90K level could result in a much deeper correction toward the $80K zone.
On-Chain Analysis
By Edris Derakhshi (TradingRage)
Long-Term Holder SOPR
On-chain analysis can always present a different perspective from that of technical analysis, as it can demonstrate the supply and demand dynamics thanks to the transparency provided by the Bitcoin network.
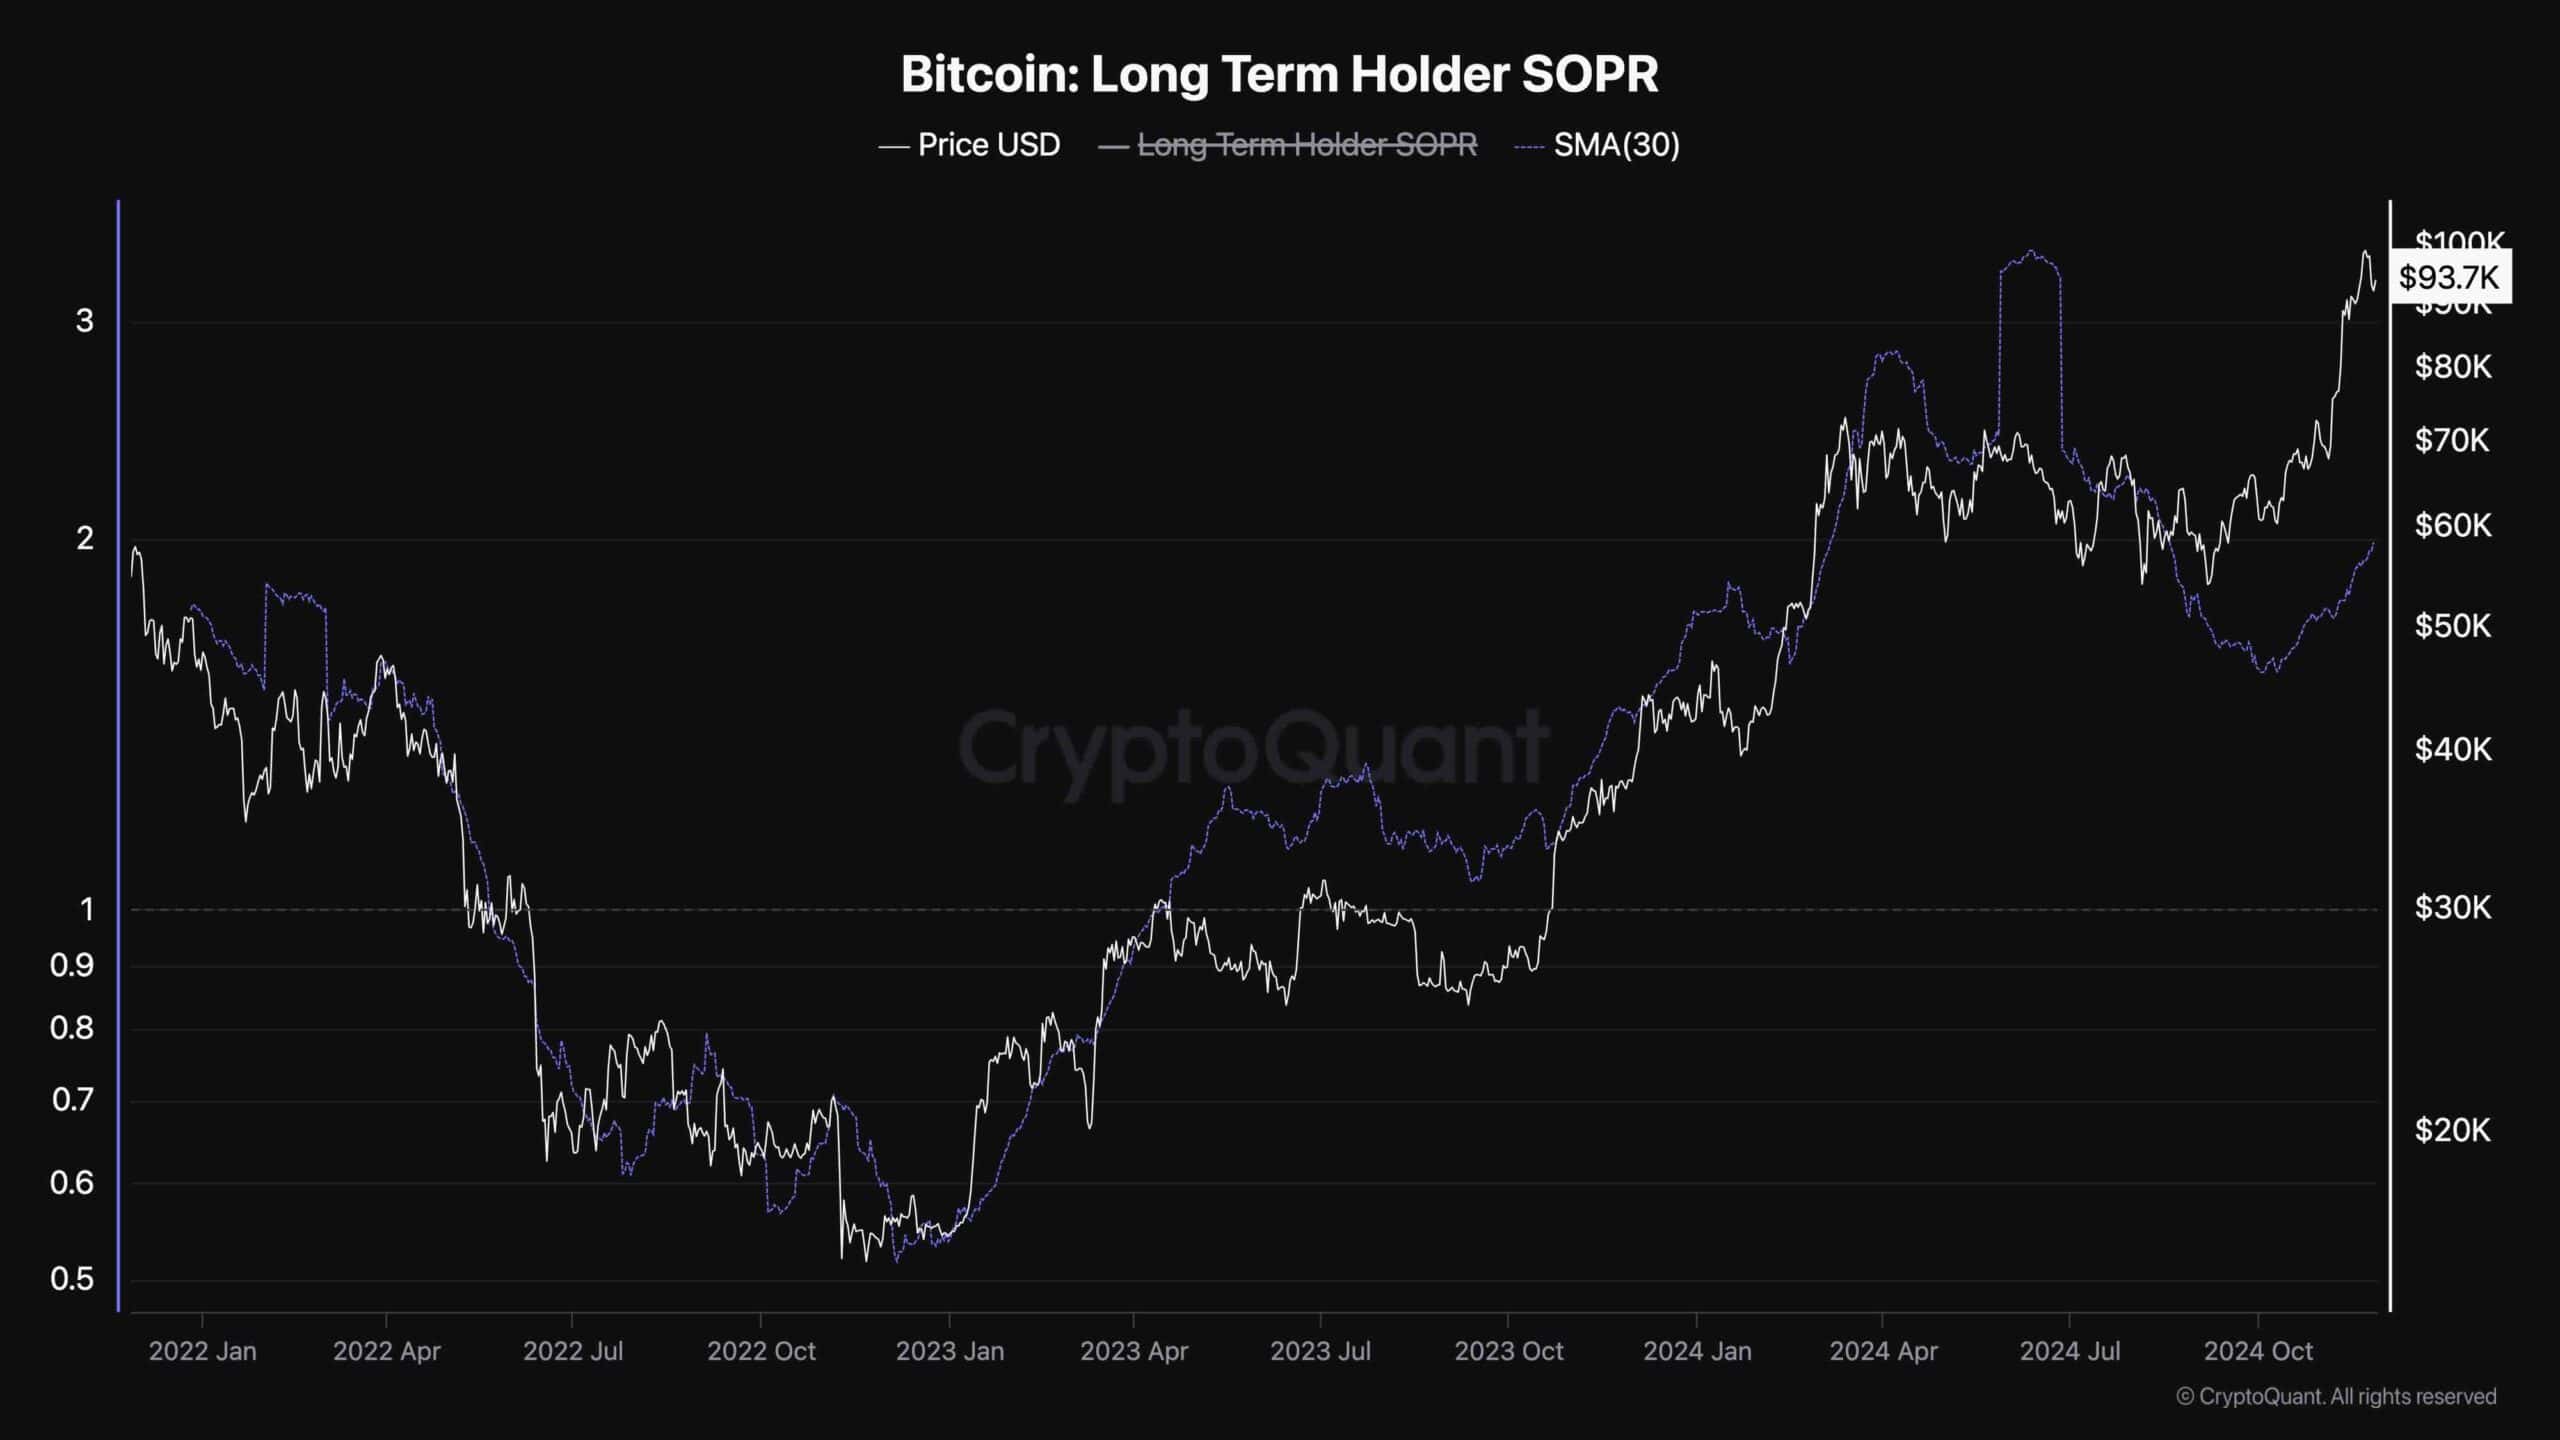
This chart displays the long-term holder SOPR metric, which measures the ratio of realized profits to losses for long-term investors. The 30-day moving average of the LTH SOPR is trending higher and has been above one for a while, indicating that the cohort is realizing profits as the market rallies.
While you can consider this a bearish sign, as profit realization can overwhelm the market with supply, this might not be the case.
LTH SOPR is much lower than during the last all-time high range earlier this year. Therefore, it can be concluded that the price can still go higher before a massive profit-taking event takes place by long-term investors.
[ad_2]