

Close Menu
  • Coins
    • Bitcoin
    • Ethereum
    • Altcoins
    • NFT
  • Blockchain
  • DeFi
  • Metaverse
  • Regulation
  • Other
    • Exchanges
    • ICO
    • GameFi
    • Mining
    • Legal
  • MarketCap
What's Hot

Komainu Featured in Jersey Finance’s Fintech Spotlight Series

28/09/2026

How Much LUNC Burns Really Cut the Supply

28/09/2026

Dubai’s crypto regulator tightens VARA VASP compliance rules, effective immediately

28/09/2026
Facebook X (Twitter) Instagram
  • Back to NBTC homepage
  • Privacy Policy
  • Contact
X (Twitter) Telegram Facebook LinkedIn RSS
NBTC News
  • Coins
    1. Bitcoin
    2. Ethereum
    3. Altcoins
    4. NFT
    5. View All

    Bitcoin staking goes live on Stacks, marking a major on‑chain milestone

    28/09/2026

    Luke Dashjr Proposes Zero Bitcoin Subsidies for 30 Days to Challenge Profit-Driven Miners

    28/09/2026

    1,000 Bitcoin Transferred to Robinhood

    28/09/2026

    Bitcoin exchange inflows fall 15.5% as whales pause near $79K: Is demand falling?

    28/09/2026

    $2,650 holds as daily trend fights short-term fatigue

    28/09/2026

    Ethereum shorts jump 13,000% – Is ETH laying out a $3K bear trap?

    28/09/2026

    Ethereum price could rally to $5,000: Arthur Hayes

    28/09/2026

    Where is Ethereum Heading on Exchanges? Supply Has Fallen to a Record Low! What Does This Mean for the ETH Price?

    27/09/2026

    How Much LUNC Burns Really Cut the Supply

    28/09/2026

    Hyperliquid Whale With 99% Win Rate Adds to $1.36M XRP Long Despite 21% Loss

    28/09/2026

    SolanaFloor Analyzes ORE’s Market Outlook

    28/09/2026

    How Did a “Dogecoin Killer” Become a Multi-Billion-Dollar Coin Without a Real Plan?

    28/09/2026

    The NFT party is over and everybody now owes storage rent

    27/09/2026

    How to reclaim your rescued NFTs after legacy Magic Eden approval exploit

    26/09/2026

    NFT sales rise 57.17% to $55.5M as Ethereum leads

    26/09/2026

    Whitehats rescue $5.7 million in NFTs after Limit Break Payment Processor exploit

    25/09/2026

    Komainu Featured in Jersey Finance’s Fintech Spotlight Series

    28/09/2026

    How Much LUNC Burns Really Cut the Supply

    28/09/2026

    Dubai’s crypto regulator tightens VARA VASP compliance rules, effective immediately

    28/09/2026

    Crypto-friendly institution Franklin Templeton brings its tokenized collateral service to Bybit

    28/09/2026
  • Blockchain

    EU financial watchdogs warn quantum computing poses imminent threat to blockchain encryption

    28/09/2026

    Circle expands CCTP to EURC and cirBTC on Arc

    28/09/2026

    Hedera Expands Enterprise Open Source Commitment Via Linux Foundation Contribution

    28/09/2026

    Brazil’s Energy Market Tokenizes Supply on Solana Platform

    28/09/2026

    Bullish, Alpaca and Apex Fintech form coalition to push issuer-backed tokenized stocks

    28/09/2026
  • DeFi

    Aave’s live stock-token loans expose USDC lenders to a weekend price gap

    28/09/2026

    EU faces September 30 clock to decide future of DeFi loans

    27/09/2026

    AlphaFi Winds Down After Oracle Error, With Sui Foundation Support

    27/09/2026

    Morpho Blames AI Marketing Tool for Deleted Post Saying Its Own Curator Business Model is Broken

    27/09/2026

    Coinbase tokenized stocks go live on Aave V4 on Base

    26/09/2026
  • Metaverse

    Is Solana Gaming Back? Kintara Activity Fuels Renewed Optimism in Onchain MMOs

    24/06/2026

    The Sandbox launches AI game engine ‘The Sandbox Studio’ for next-generation creators

    10/06/2026

    Meta commits $13M in funding for Oversight Board through 2028

    29/05/2026

    Why Animoca’s Yat Siu says the future is 100 billion AI agents

    07/05/2026

    ‘8,000 Jobs’—Polymarket Sees Tech Layoff Surge As Meta AI Push Bites

    18/04/2026
  • Regulation

    Komainu Featured in Jersey Finance’s Fintech Spotlight Series

    28/09/2026

    Binance Casts Shadow Over ECB’s Digital Euro Ambitions

    28/09/2026

    CoreWeave stock jumps, but a risky pattern points to a reversal

    28/09/2026

    US Crypto Ownership Falls From 2025 High to 11% of Investors

    28/09/2026

    Nvidia SB Energy investment hits $3 billion ahead of $50 billion IPO

    28/09/2026
  • Other
    1. Exchanges
    2. ICO
    3. GameFi
    4. Mining
    5. Legal
    6. View All

    Crypto-friendly institution Franklin Templeton brings its tokenized collateral service to Bybit

    28/09/2026

    Wintermute’s Hyperliquid shorts reach $126M across ETH, BTC and SOL

    28/09/2026

    How did a user lose $340K?

    28/09/2026

    PopDEX pits Robinhood Chain against BNB Chain

    28/09/2026

    ICO market slows sharply with only six completions in 2026

    30/04/2026

    South Korea Poised to Lift Ban on Domestic ICOs After 7 Years

    19/12/2025

    Why 2025’s Token Boom Looks Both Familiar and Dangerous

    31/10/2025

    ICO for bitcoin yield farming chain Corn screams we’re so back

    22/01/2025

    Top 12 NFT games every player should know about in August 2026

    19/08/2026

    GameShame Studios founder details Raijin Protocol’s roadmap in NeoPod’s sixth AMA

    13/08/2026

    How BC.GAME is turning players into stakeholders

    04/08/2026

    YGG Play Shuts Down Services as Yield Guild Pivots to AI Data

    01/08/2026

    Riot Platforms repays $200M credit facility, releases collateral

    28/09/2026

    Bitcoin hashrate falls to 3-week low as miners cut BTC

    27/09/2026

    Will Kazakhstan’s new Bitcoin mining strategy evolve into an AI compute playbook?

    27/09/2026

    Bitcoin Miner Hive Escalates Swedish VAT Dispute to European Commission

    26/09/2026

    Dubai’s crypto regulator tightens VARA VASP compliance rules, effective immediately

    28/09/2026

    Ripple Pioneer Returns to SEC Case After Spotting Familiar Tactics Outside Crypto

    28/09/2026

    Former Polish Police Officer Charged as Zondacrypto Probe Searches Fuel Depot

    28/09/2026

    What Shortcomings Were Identified in Cryptocurrency Companies?

    28/09/2026

    Komainu Featured in Jersey Finance’s Fintech Spotlight Series

    28/09/2026

    How Much LUNC Burns Really Cut the Supply

    28/09/2026

    Dubai’s crypto regulator tightens VARA VASP compliance rules, effective immediately

    28/09/2026

    Crypto-friendly institution Franklin Templeton brings its tokenized collateral service to Bybit

    28/09/2026
  • MarketCap
NBTC News
Home»Bitcoin»How to Use Bollinger Bands for Bitcoin (BTC) Price Prediction
Bitcoin

How to Use Bollinger Bands for Bitcoin (BTC) Price Prediction

NBTCBy NBTC23/03/2024No Comments5 Mins Read
Share
Facebook Twitter LinkedIn Pinterest Email


What are Bollinger Bands?

Bollinger Bands are a technical analysis tool used to gauge the volatility of assets like stocks. They help traders to identify overbought and oversold conditions based on mean reversion principles.

Bollinger Bands consist of three lines: a middle line that represents the asset’s moving average and two outer bands that are positioned a certain distance away from the middle line, typically based on standard deviations. The bands expand and contract based on the asset’s volatility.

This tool was developed by legendary trader John Bollinger in the 1980s. Bollinger Bands provide insights into market conditions by combining the concepts of a moving average and a volatility measure in one indicator.

As volatility tends to revert to its mean over time, the contraction of the bands often precedes an expansion and a potential price breakout. By monitoring the expanding and contracting bands, traders can anticipate market shifts and improve their trading outcomes.

How do they work?

Bollinger Bands track market volatility, expanding during high volatility and contracting during low volatility. This helps traders identify potential buy or sell signals, such as when the price of the asset moves close to or beyond the outer bands. For instance, here’s Bitcoin Historical Volatility Index chart for 2024:
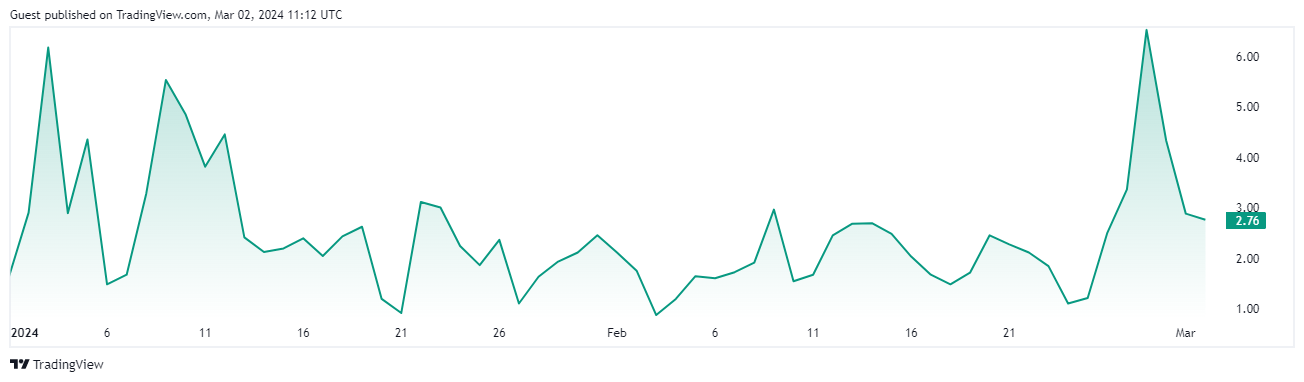
As volatility often reverts to its mean, bands are likely to expand, potentially causing significant price movements. Monitoring these band movements helps traders anticipate breakouts and reversals for more successful trades.

In simple terms, when the price nears the upper band, it is considered overbought and may correct, while near the lower band suggests oversold conditions and a potential rebound. In range-bound markets, traders may buy at the lower band and sell at the upper band.

Upper and lower bands are created by adding and subtracting a multiple of standard deviations (usually two) from the SMA. This forms an envelope around the price series, representing high and low volatility levels. Standard deviation measures price dispersion from the SMA, quantifying volatility. It is typically calculated using the same period as the SMA.

As an example, on Feb. 12, Bollinger highlighted in his post on X the price action of Bitcoin reaching the upper Bollinger Band, signaling a bullish trend.
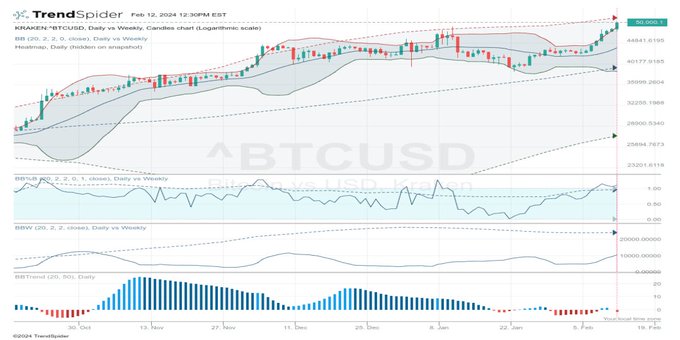
Not only has the price surpassed the upper band, but it has also surpassed the $50,000 threshold, a significant psychological resistance level influenced by human psychology and trading patterns.

Where do you start?

You start by computing the simple moving average (SMA), typically employing a 20-day SMA. The 20-day SMA encompasses averaging the closing prices over the initial 20 days to establish the initial data point.

Subsequently, the standard deviation value is multiplied by two, with the resulting product being both added to and subtracted from each data point along the SMA. This process generates the upper and lower bands, delineating the boundaries of the Bollinger Bands.

Upper band

The upper band within Bollinger Bands marks a price level that sits two standard deviations above the middle band, encompassing roughly 95% of the price action. Acting as a dynamic resistance threshold, it assists traders in pinpointing potential overbought scenarios and determining optimal entry or exit points.

Calculating the upper band involves adding two standard deviations to the 20-day simple moving average (SMA) of the asset’s price. This upper band acts as a flexible resistance level, offering guidance to traders on when to open long positions or exit short positions in the market.

Middle band

The middle band, often referred to as the moving average, is determined using a 20-day time frame and acts as a foundational reference point for both the upper and lower bands. Serving as an indicator of the security’s average price over the specified period, it facilitates the identification of price trends and potential reversals.

To compute the simple moving average (SMA) for Bollinger Bands, the closing prices across a designated number of periods are averaged. This resultant moving average functions as the middle band within the Bollinger Bands framework, enabling traders to discern prevailing price trends and potential reversal zones in the market.

Lower band

The lower bandis two standard deviations below the middle band and helps traders recognize consolidation periods and potential breakout or reversal points. When the upper and lower bands contract, it suggests low volatility and possible breakout opportunities, guiding traders in their buying or selling decisions.

BTC price

As we look at the current BTC/USD chart, we can notice the bands widening at the end of February.

Bollinger Bands tightening during low volatility signal an impending sharp price move, possibly initiating a trend. This is usually referred to as “the squeeze.”

During strong trends, prices may persistently exceed or hug a band. Divergence with a momentum oscillator may prompt further analysis for taking additional profits. A strong trend continuation is expected when the price moves beyond the bands. Immediate retreat back inside suggests weakening strength.

Currently, the market is clear on the uptrend. However, as Bollinger recently pointed out:

Oh, there have been others. People seem to forget that the bulls are in charge most of the time and thus desire to argue with the market. Never a good idea.

— John Bollinger (@bbands) February 22, 2024

Conclusion

Bollinger Bands provide valuable insights into potential price reversals, overbought/oversold conditions and market volatility. However, traders should complement their use with other analytical techniques to make well-informed decisions.

Past price movements depicted in charts do not guarantee future outcomes, and technical analysis alone may not predict market trends accurately. Traders should combine multiple indicators like RSI for more informed decision-making.

Share. Facebook Twitter Pinterest LinkedIn Tumblr Email
NBTC

NBTC is the editorial account for NBTC News, covering Bitcoin, Ethereum, DeFi, blockchain infrastructure, exchanges, mining, regulation and digital asset markets. The editorial team focuses on clear sourcing, timely updates and practical context for crypto readers.

Related Posts

Bitcoin staking goes live on Stacks, marking a major on‑chain milestone

28/09/2026

Luke Dashjr Proposes Zero Bitcoin Subsidies for 30 Days to Challenge Profit-Driven Miners

28/09/2026

1,000 Bitcoin Transferred to Robinhood

28/09/2026

Bitcoin exchange inflows fall 15.5% as whales pause near $79K: Is demand falling?

28/09/2026
Add A Comment

Comments are closed.

Top Posts
Get Informed

Subscribe to Updates

Get the latest news from NBTC regarding crypto, blockchains and web3 related topics.

Your source for the serious news. This website is crafted specifically to for crazy and hot cryptonews. Visit our main page for more tons of news.

We're social. Connect with us:

Facebook X (Twitter) LinkedIn RSS
Top Insights

Komainu Featured in Jersey Finance’s Fintech Spotlight Series

28/09/2026

How Much LUNC Burns Really Cut the Supply

28/09/2026

Dubai’s crypto regulator tightens VARA VASP compliance rules, effective immediately

28/09/2026
Get Informed

Subscribe to Updates

Get the latest news from NBTC regarding crypto, blockchains and web3 related topics.

Type above and press Enter to search. Press Esc to cancel.