[ad_1]
Bitcoin, the pioneering cryptocurrency, continues to captivate traders and investors with its cyclical price movements and unparalleled market dominance. As of January 2025, Bitcoin has shown significant upward momentum, suggesting that it may be poised for further gains in the coming month. In this Bitcoin price analysis, we will examine the chart’s technical structure, key levels of support and resistance, and the indicators driving market sentiment to answer the pressing question: how high can Bitcoin’s price rise in the next 30 days?
Is Bitcoin Price Breaking Through Resistance Levels?

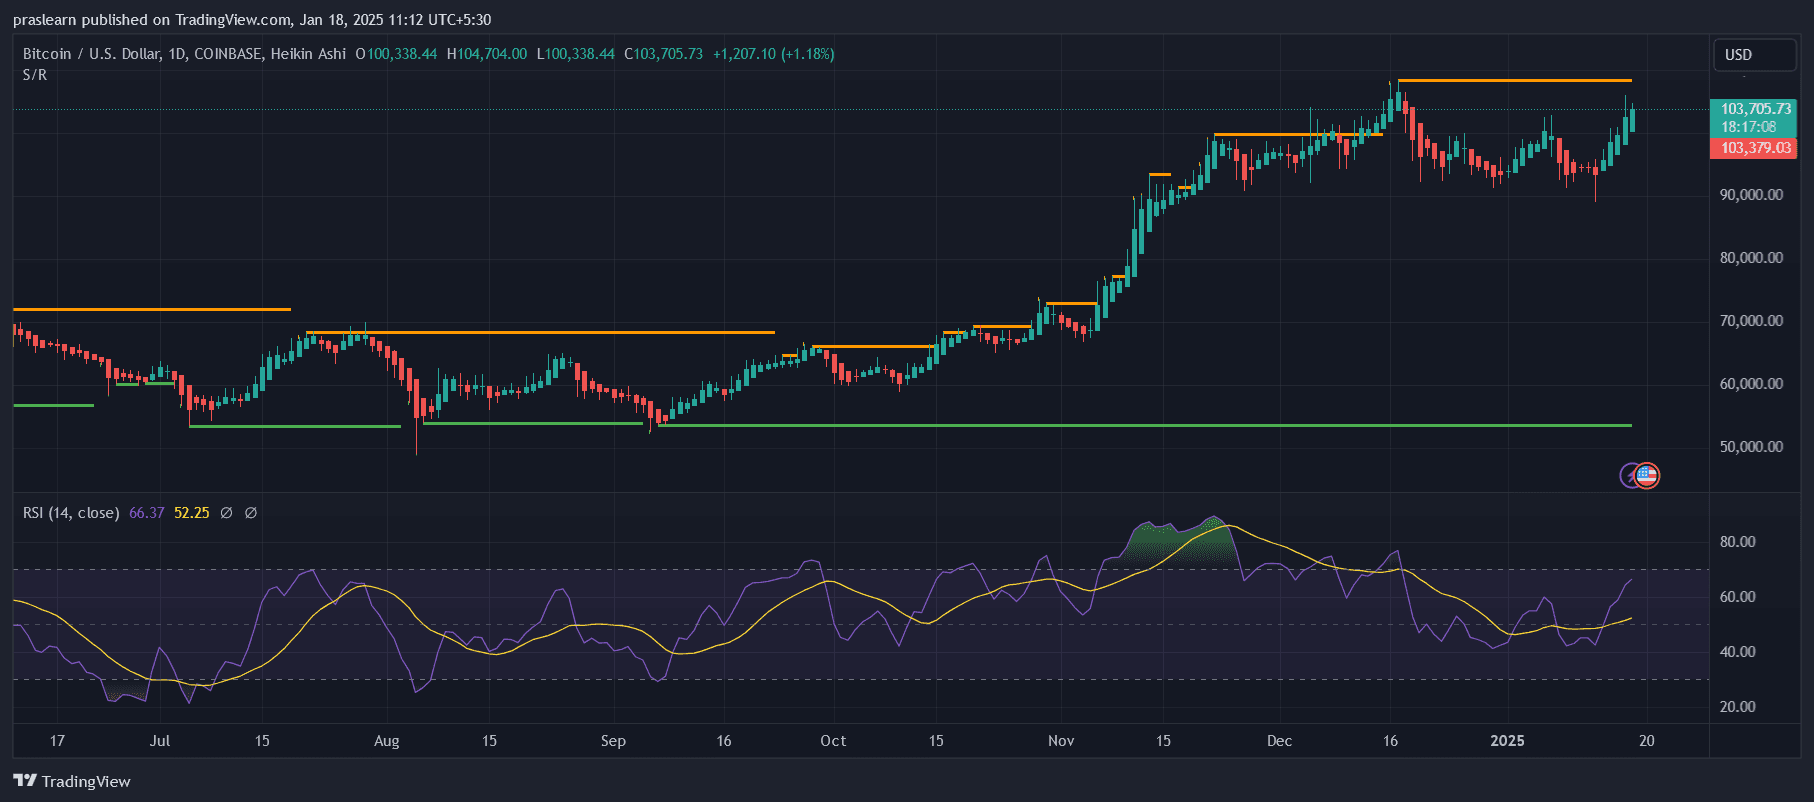
BTC/USD Daily Chart- TradingView
The chart reveals that Bitcoin is currently trading near $103,705, challenging a critical resistance zone established in the past few months. The orange horizontal lines in the chart mark historical resistance levels, where previous rallies have either stalled or reversed. Bitcoin’s recent bullish momentum, evidenced by consecutive green Heikin Ashi candles, suggests strong buying pressure.
A breakout above the current resistance around $104,000 could signal a move to higher targets, as the next significant resistance levels appear to be around $110,000 and $115,000. The volume and candlestick patterns over the next few days will be critical in determining whether this breakout is sustainable or a false signal.
What Role Does the RSI Indicator Play?
The Relative Strength Index (RSI), shown at the bottom of the chart, is currently at 66.37, indicating strong bullish momentum but not yet entering the overbought territory (above 70). This suggests that there is still room for price appreciation before the market becomes overextended. Historically, Bitcoin price has shown the potential for sharp upward moves when the RSI crosses the 70 level, driven by FOMO (fear of missing out) among traders.
If the RSI trends higher and breaches 70, it could signify an acceleration in buying activity, potentially pushing Bitcoin toward the $115,000 mark. However, traders should remain cautious of a potential bearish divergence, where the RSI begins to decline while prices continue to rise, as this often precedes a correction.
How Significant Are the Current Support Levels?
The green horizontal lines on the chart mark critical support levels around $90,000, which acted as a base for Bitcoin price recent rally. This support zone is vital for maintaining bullish sentiment; a breakdown below it could negate the current uptrend and expose Bitcoin to further downside risks.
Given the strength of the current uptrend and the proximity of the 50-day moving average (not shown in the chart), it is unlikely that Bitcoin will revisit this level in the next 30 days unless faced with a significant macroeconomic or market-specific shock.
What Can We Expect From Market Sentiment and Fundamentals?
Beyond the chart, market sentiment plays a significant role in determining Bitcoin’s price trajectory. Recent macroeconomic developments, such as reduced inflationary pressures and increased institutional adoption, have created a favorable backdrop for Bitcoin. Additionally, the upcoming Bitcoin halving event, which reduces mining rewards, is likely fueling bullish speculation. This confluence of technical and fundamental factors supports the case for continued upside in Bitcoin’s price.
Conclusion
Based on the chart’s technical analysis, Bitcoin appears well-positioned for further gains in the next 30 days. A breakout above $104,000 could propel prices toward the $110,000 to $115,000 range, supported by strong RSI momentum and bullish market sentiment. However, traders should closely monitor the RSI and volume dynamics to confirm the sustainability of the uptrend. While downside risks remain minimal in the near term, maintaining the $90,000 support level will be crucial for preserving Bitcoin’s bullish outlook.
[ad_2]

