Ethereum (ETH) price is showing a period of uncertainty as key indicators point to a lack of strong directional momentum. The DMI shows a weak trend, with the ADX below 20 for several days, highlighting market indecision.
Additionally, the number of ETH whale addresses has declined since hitting an 11-month high, signaling potential shifts in market sentiment. As ETH’s EMA lines remain undefined, the coin’s next move will likely depend on its ability to break key resistance levels or hold critical support zones.
ETH DMI Indicates Weak Momentum
The Ethereum DMI (Directional Movement Index) chart reveals that the ADX is currently at 12.5 and has remained below 20 for the past four days. The ADX (Average Directional Index) measures the strength of a trend, with readings below 20 indicating a weak or undefined trend.
This lack of trend strength suggests that ETH is currently in a period of indecision or consolidation, with no clear directional momentum dominating the market.
ETH DMI. Source: TradingView
In addition to the low ADX, the +DI (positive directional indicator) is at 24.9, while the -DI (negative directional indicator) is at 30.8. The higher -DI compared to +DI suggests that bearish momentum has a slight edge, though the weak ADX indicates that this bearish pressure is not strongly driving the price.
With the trend appearing undefined, Ethereum may continue to move sideways until stronger market momentum – either bullish or bearish — emerges to break the current stalemate.
ETH Whale Addresses Decline After Recent 11-Month High
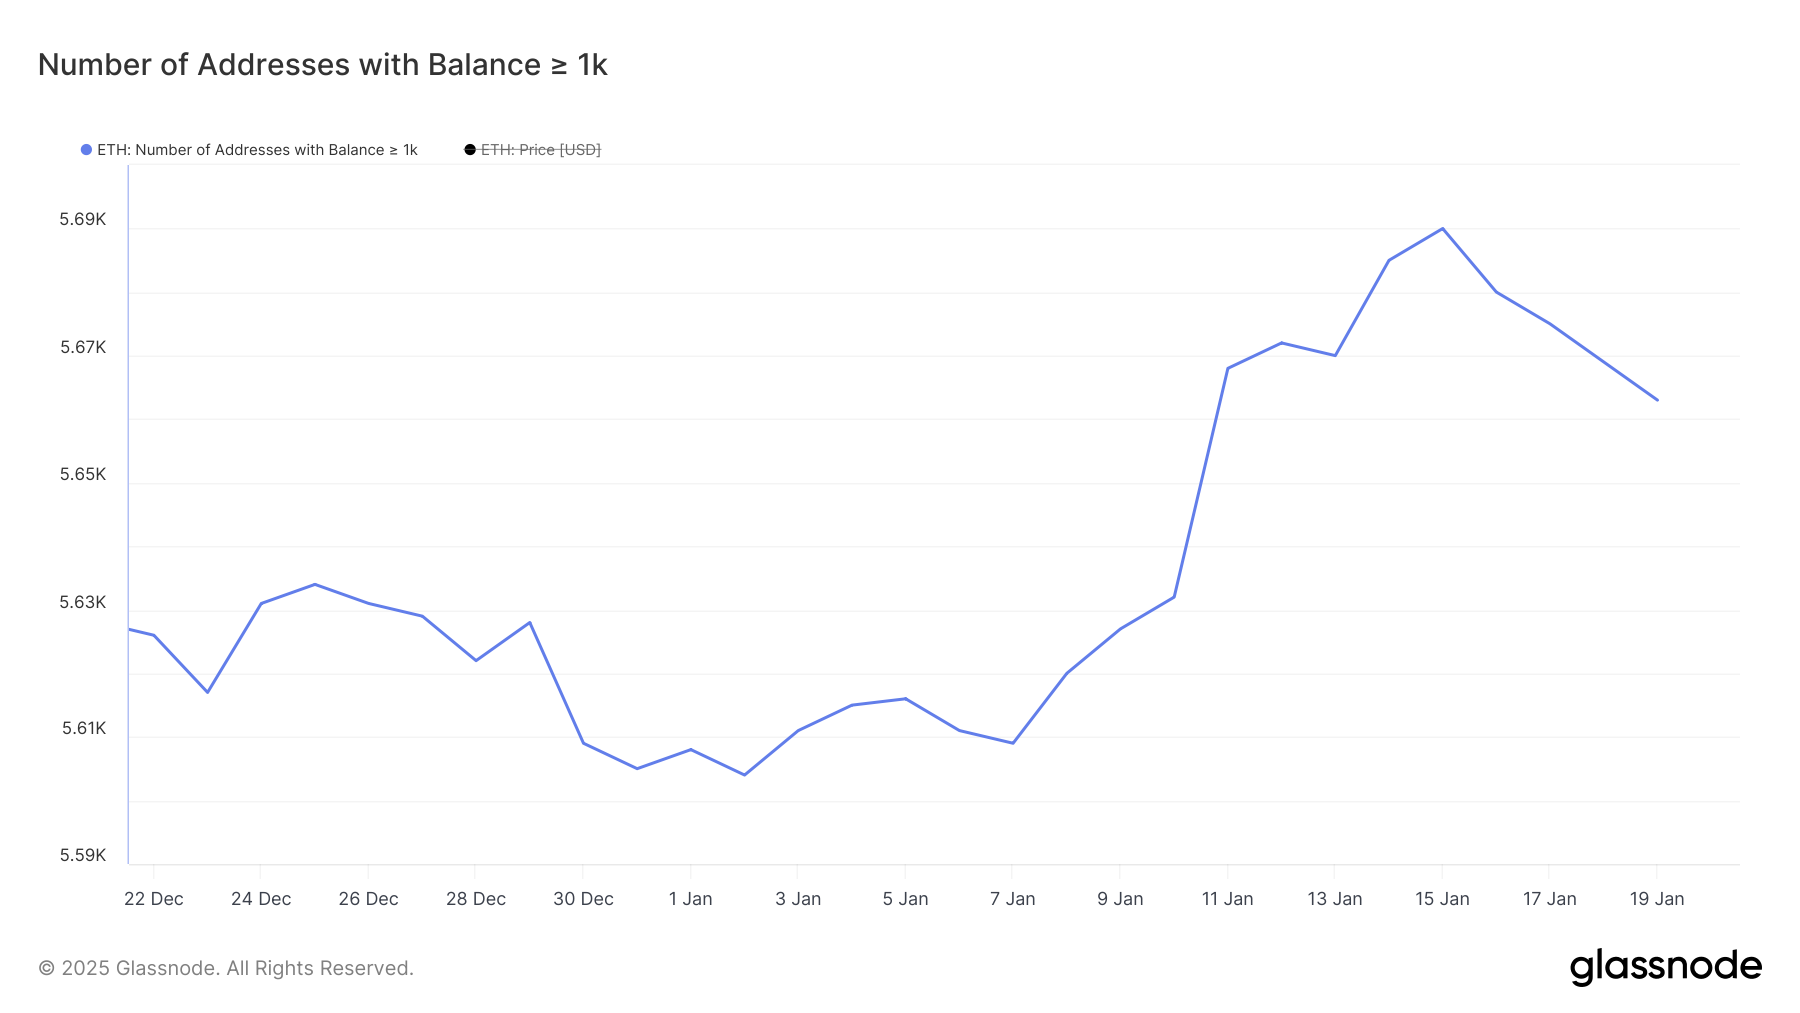
The number of ETH whales — addresses holding at least 1,000 ETH — hit an 11-month high of 5,690 on January 15 but has since declined to 5,663.
Tracking these whales is crucial because their accumulation or distribution often signals shifts in market sentiment and potential price trends. Large holders can influence the market significantly, and their activity provides valuable insights into broader investment patterns.

Addresses with Balance >= 1,000 ETH. Source: Glassnode
This recent decline in ETH whale addresses could be linked to the surge in interest and capital flowing into other assets like BTC, TRUMP, SOL, and other altcoins. As these alternatives outperform or attract attention, some ETH whales may be reallocating their holdings, potentially contributing to selling pressure on ETH price.
If this trend continues, ETH’s price could face challenges, especially if capital rotation reduces its market dominance in favor of other coins.
ETH Price Prediction: EMA Lines Show No Clear Direction Yet
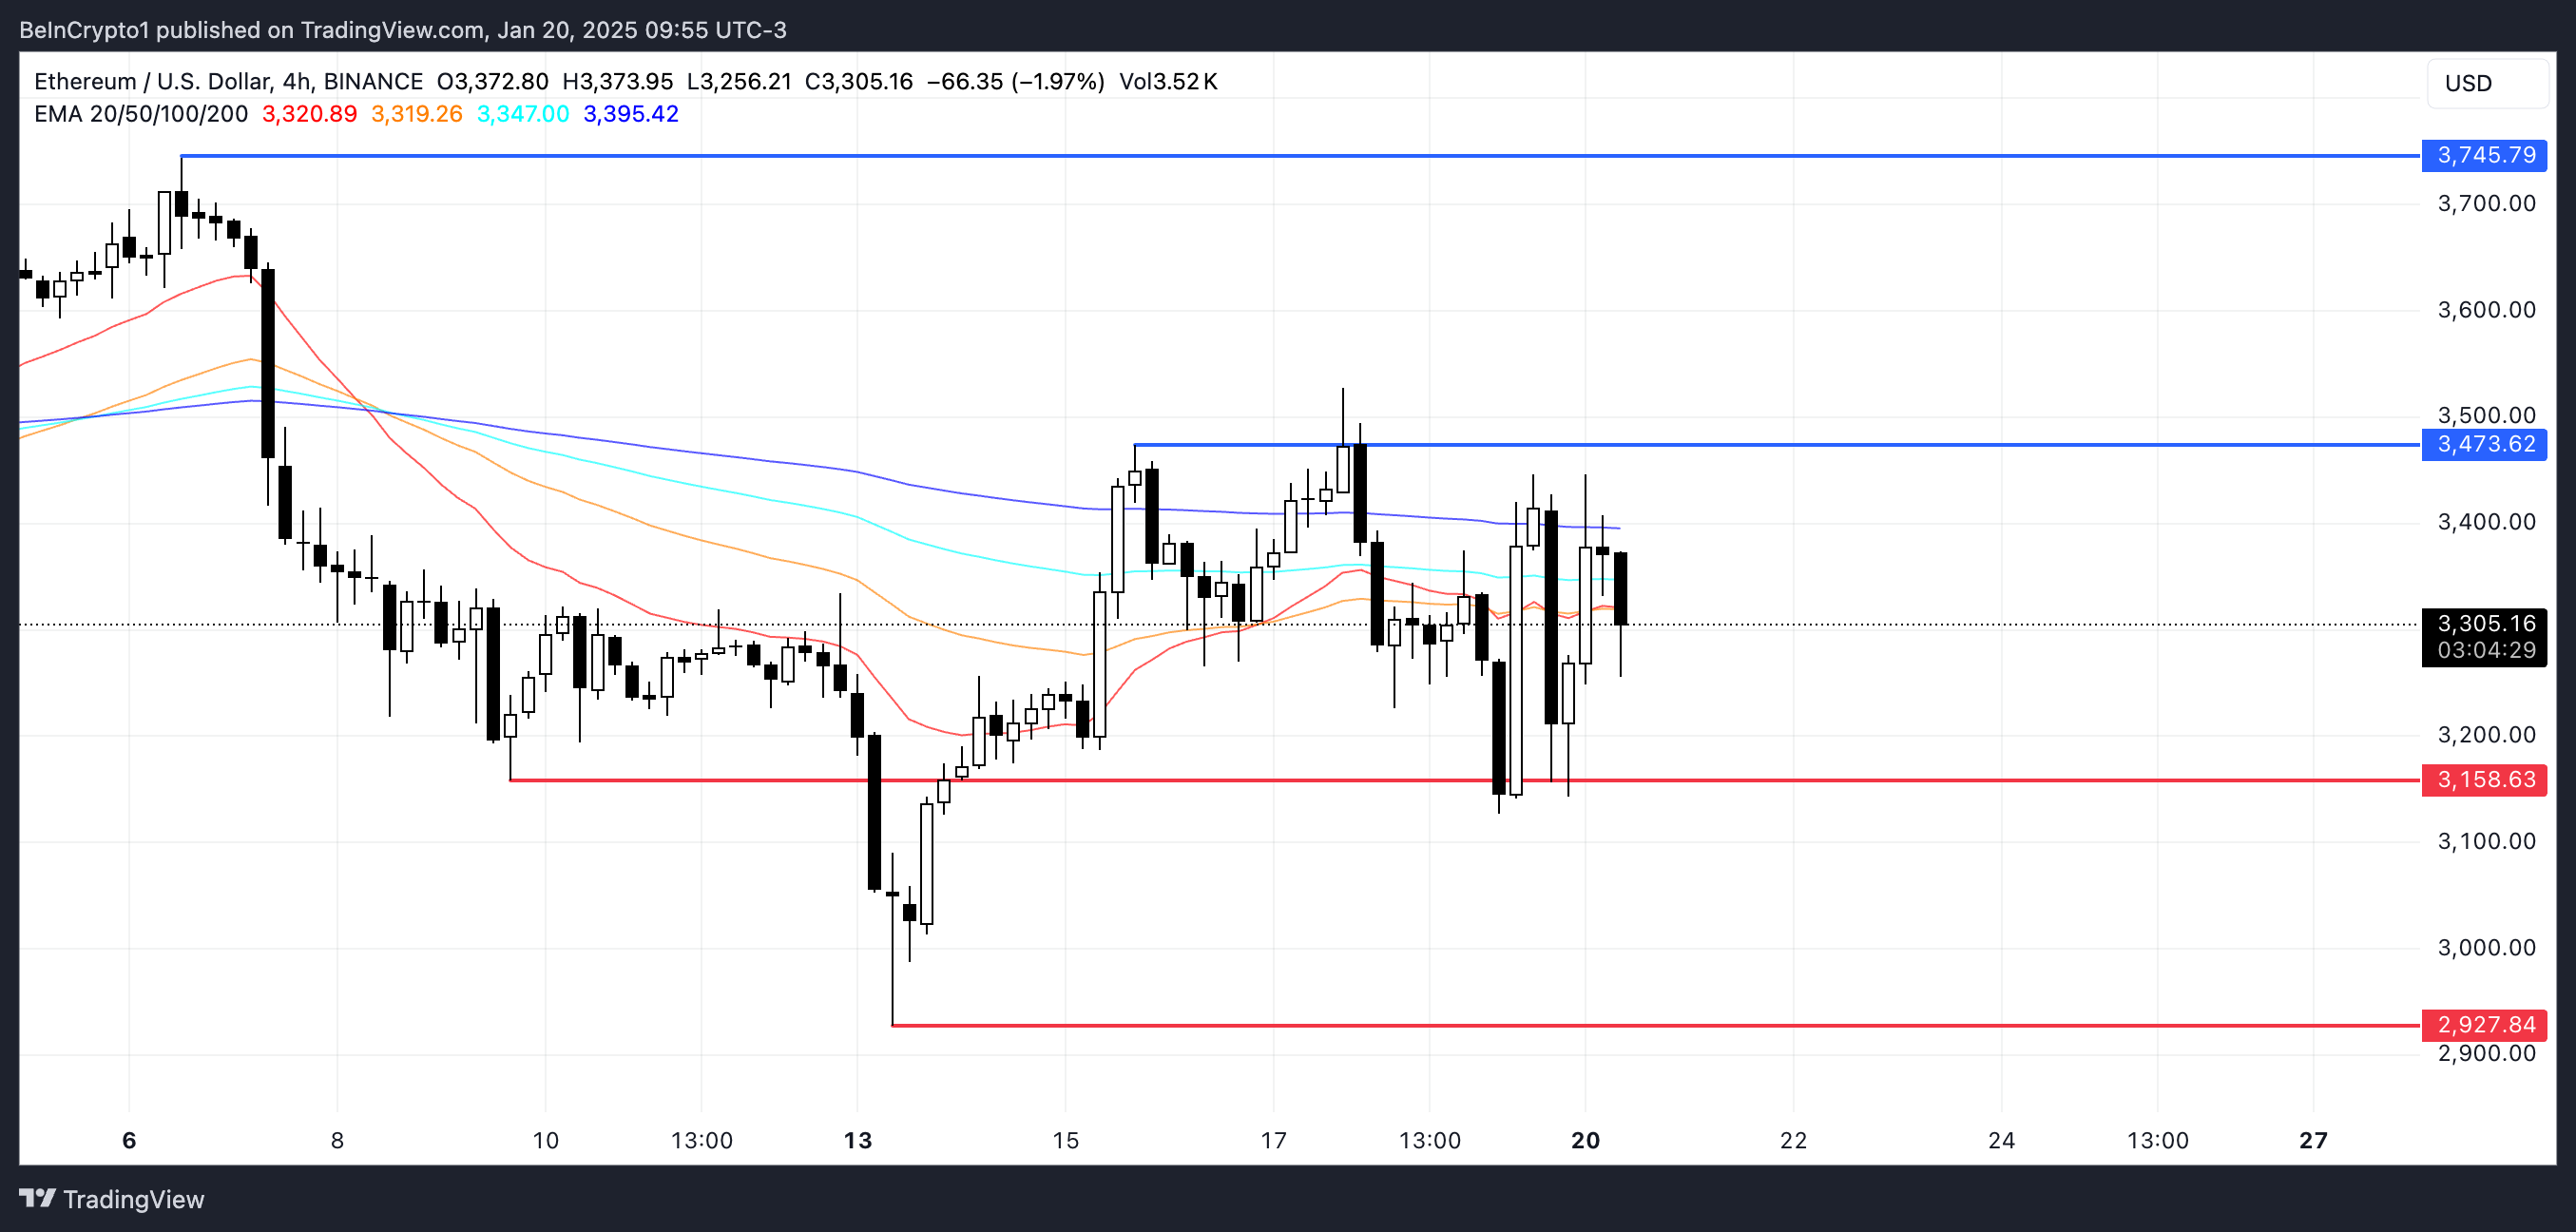
ETH’s EMA lines indicate that its current trend remains undefined, reflecting a lack of clear direction in the market. While ETH rose between January 13 and January 16, its performance over the last seven days has lagged behind major coins.
BTC surged by 17%, XRP by 36%, and SOL by 43%, with Ethereum price rising 7.6% in the last seven days.

ETH Price Analysis. Source: TradingView
If ETH can establish a strong uptrend, it may target the key resistance level at $3,473. A successful breakout above this level could pave the way for a further rise toward $3,745.
However, if the current uncertainty persists and downward momentum builds, ETH price could test the support at $3,158. A breakdown below this level could see ETH decline further, potentially reaching as low as $2,927.

