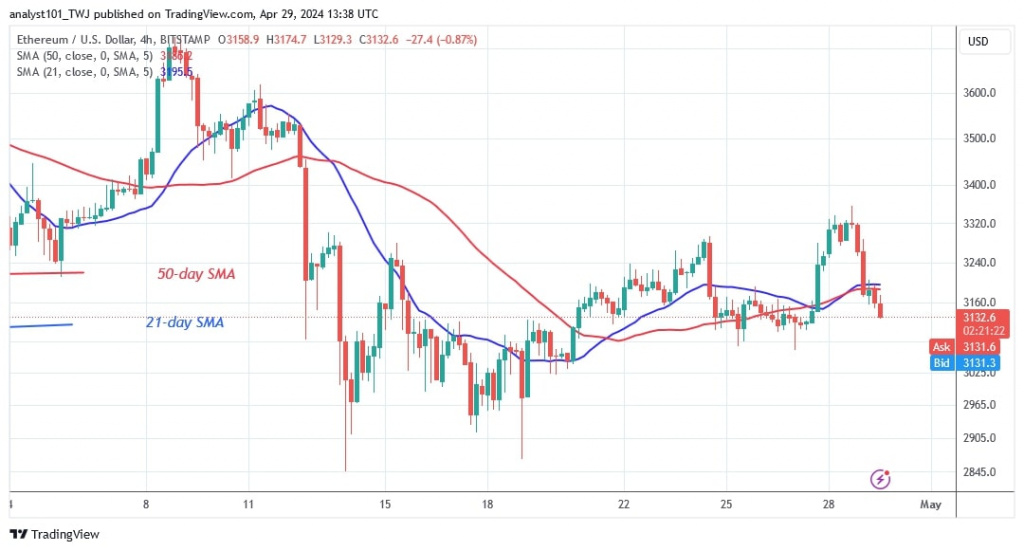
The price of Ethereum (ETH) has fallen below the moving average lines again after the recent rise on April 28, 2024.
Long-term analysis of the Ethereum price: bearish
On April 28, the Ether price climbed to a high of $3,363 after breaking through the 21-day SMA. Buyers failed to sustain their bullish momentum above the 50-day SMA or the $3,400 mark. On April 28, the long candlestick wick suggests significant selling pressure at a high of $3,400.
Now, the largest altcoin has fallen between $2,908 and $3,200. Ethereum is currently worth $3,136.60.
If the selling pressure continues, the altcoin will return to its previous lows of $3,056 and $2,908. In the meantime, Ether is trading above $31,000.
Analysis of the Ethereum indicators
Ether’s price bars are now below the moving average lines after previously being trapped between them. The moving average lines have remained horizontal despite the sideways trend. On the downside, a long candlestick tail indicating strong buying pressure helps to identify the lower price area.
Technical indicators:
Key resistance levels – $4,000 and $4,500
Key support levels – $3,500 and $3,000
What is the next direction for Ethereum?
Ethereum has slipped into the negative trend zone after a strong rejection of the previous high. The altcoin fell to a low of almost $3,118 before resuming consolidation above it. The altcoin is now trading within its limited range. The price action has been limited by the Doji candlesticks, which have consolidated above the existing support.

Coinidol.com world cryptocurrency news outlet reported on April 26, that ETH was in an upward correction and rallied to the 21-day SMA or resistance at $3,200.
Disclaimer. This analysis and forecast are the personal opinions of the author and are not a recommendation to buy or sell cryptocurrency and should not be viewed as an endorsement by CoinIdol.com. Readers should do their research before investing in funds.

