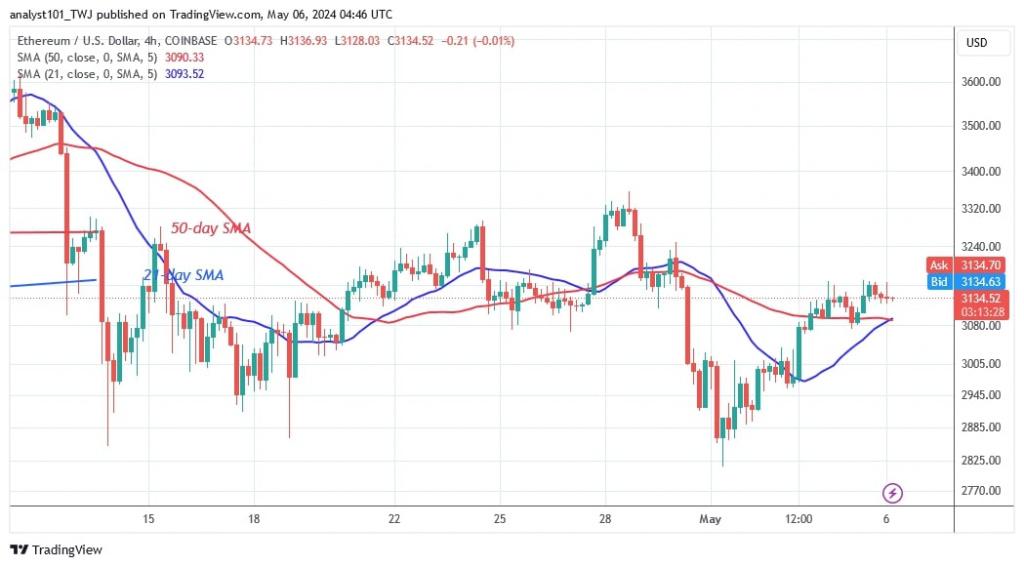
The price of Ethereum (ETH) is recovering after breaking above the 21-day SMA. Ethereum price analysis by Coinidol.com.
Long-term analysis of the Ethereum price: bearish
The price of the cryptocurrency is rising as it finds support above the 21-day SMA. The largest altcoin is predicted to reach the top of the 50-day SMA or the $3,300 resistance level.
However, in previous price action, on April 28, 2024, as reported by Coinidol.com, the bulls broke through the 21-day SMA but were rejected at the high of $3,363. The reluctance caused the altcoin to drop to a low of $2,824.50. The bulls bought the dips and the altcoin rallied above the 21-day SMA. Ether is currently valued at $3,150.50. It is trading above the 21-day SMA but below the 50-day SMA.
On the upside, Ether will return to previous highs but face resistance at $3,400. Selling pressure will pick up again if the bears break the 21-day SMA support line.
Analysis of the Ethereum indicators
After the current rally, Ether will try to return to its previous highs. The altcoin tends to fluctuate between the moving average lines. On the 4-hour chart, Ether will rise as the price bars are above the moving average lines.
Technical indicators:
Key resistance levels – $4,000 and $4,500
Key support levels – $3,500 and $3,000
What’s next for Ethereum?
The largest altcoin is trading in a range after its price drop on April 13. Ether oscillated between $2,800 and $3,300. Today, the altcoin is rising and testing the $3,300 mark for the second time. If buyers manage to reach the recent high, the cryptocurrency value will resume its positive trajectory.

Disclaimer. This analysis and forecast are the personal opinions of the author and are not a recommendation to buy or sell cryptocurrency and should not be viewed as an endorsement by CoinIdol.com. Readers should do their research before investing in funds.

