
[ad_1]
As Bitcoin crashes near the $86,000 mark, Ethereum has broken the $2,400 support level. Currently, ETH trades at a market price of $2,352 after a 6.40% drop last night.
ETH price reveals a 0.80% intraday recovery, hinting at a bullish struggle to hold the $2,300 support level. Amid the broader market crash, will Ethereum survive above the $2,000 mark?
Ethereum Nears Falling Channel Breakdown
In the daily chart, the Ethereum price trend reveals a falling channel pattern. Currently, the ETH price has dropped to the local support trendline, close to the $2,300 support level.
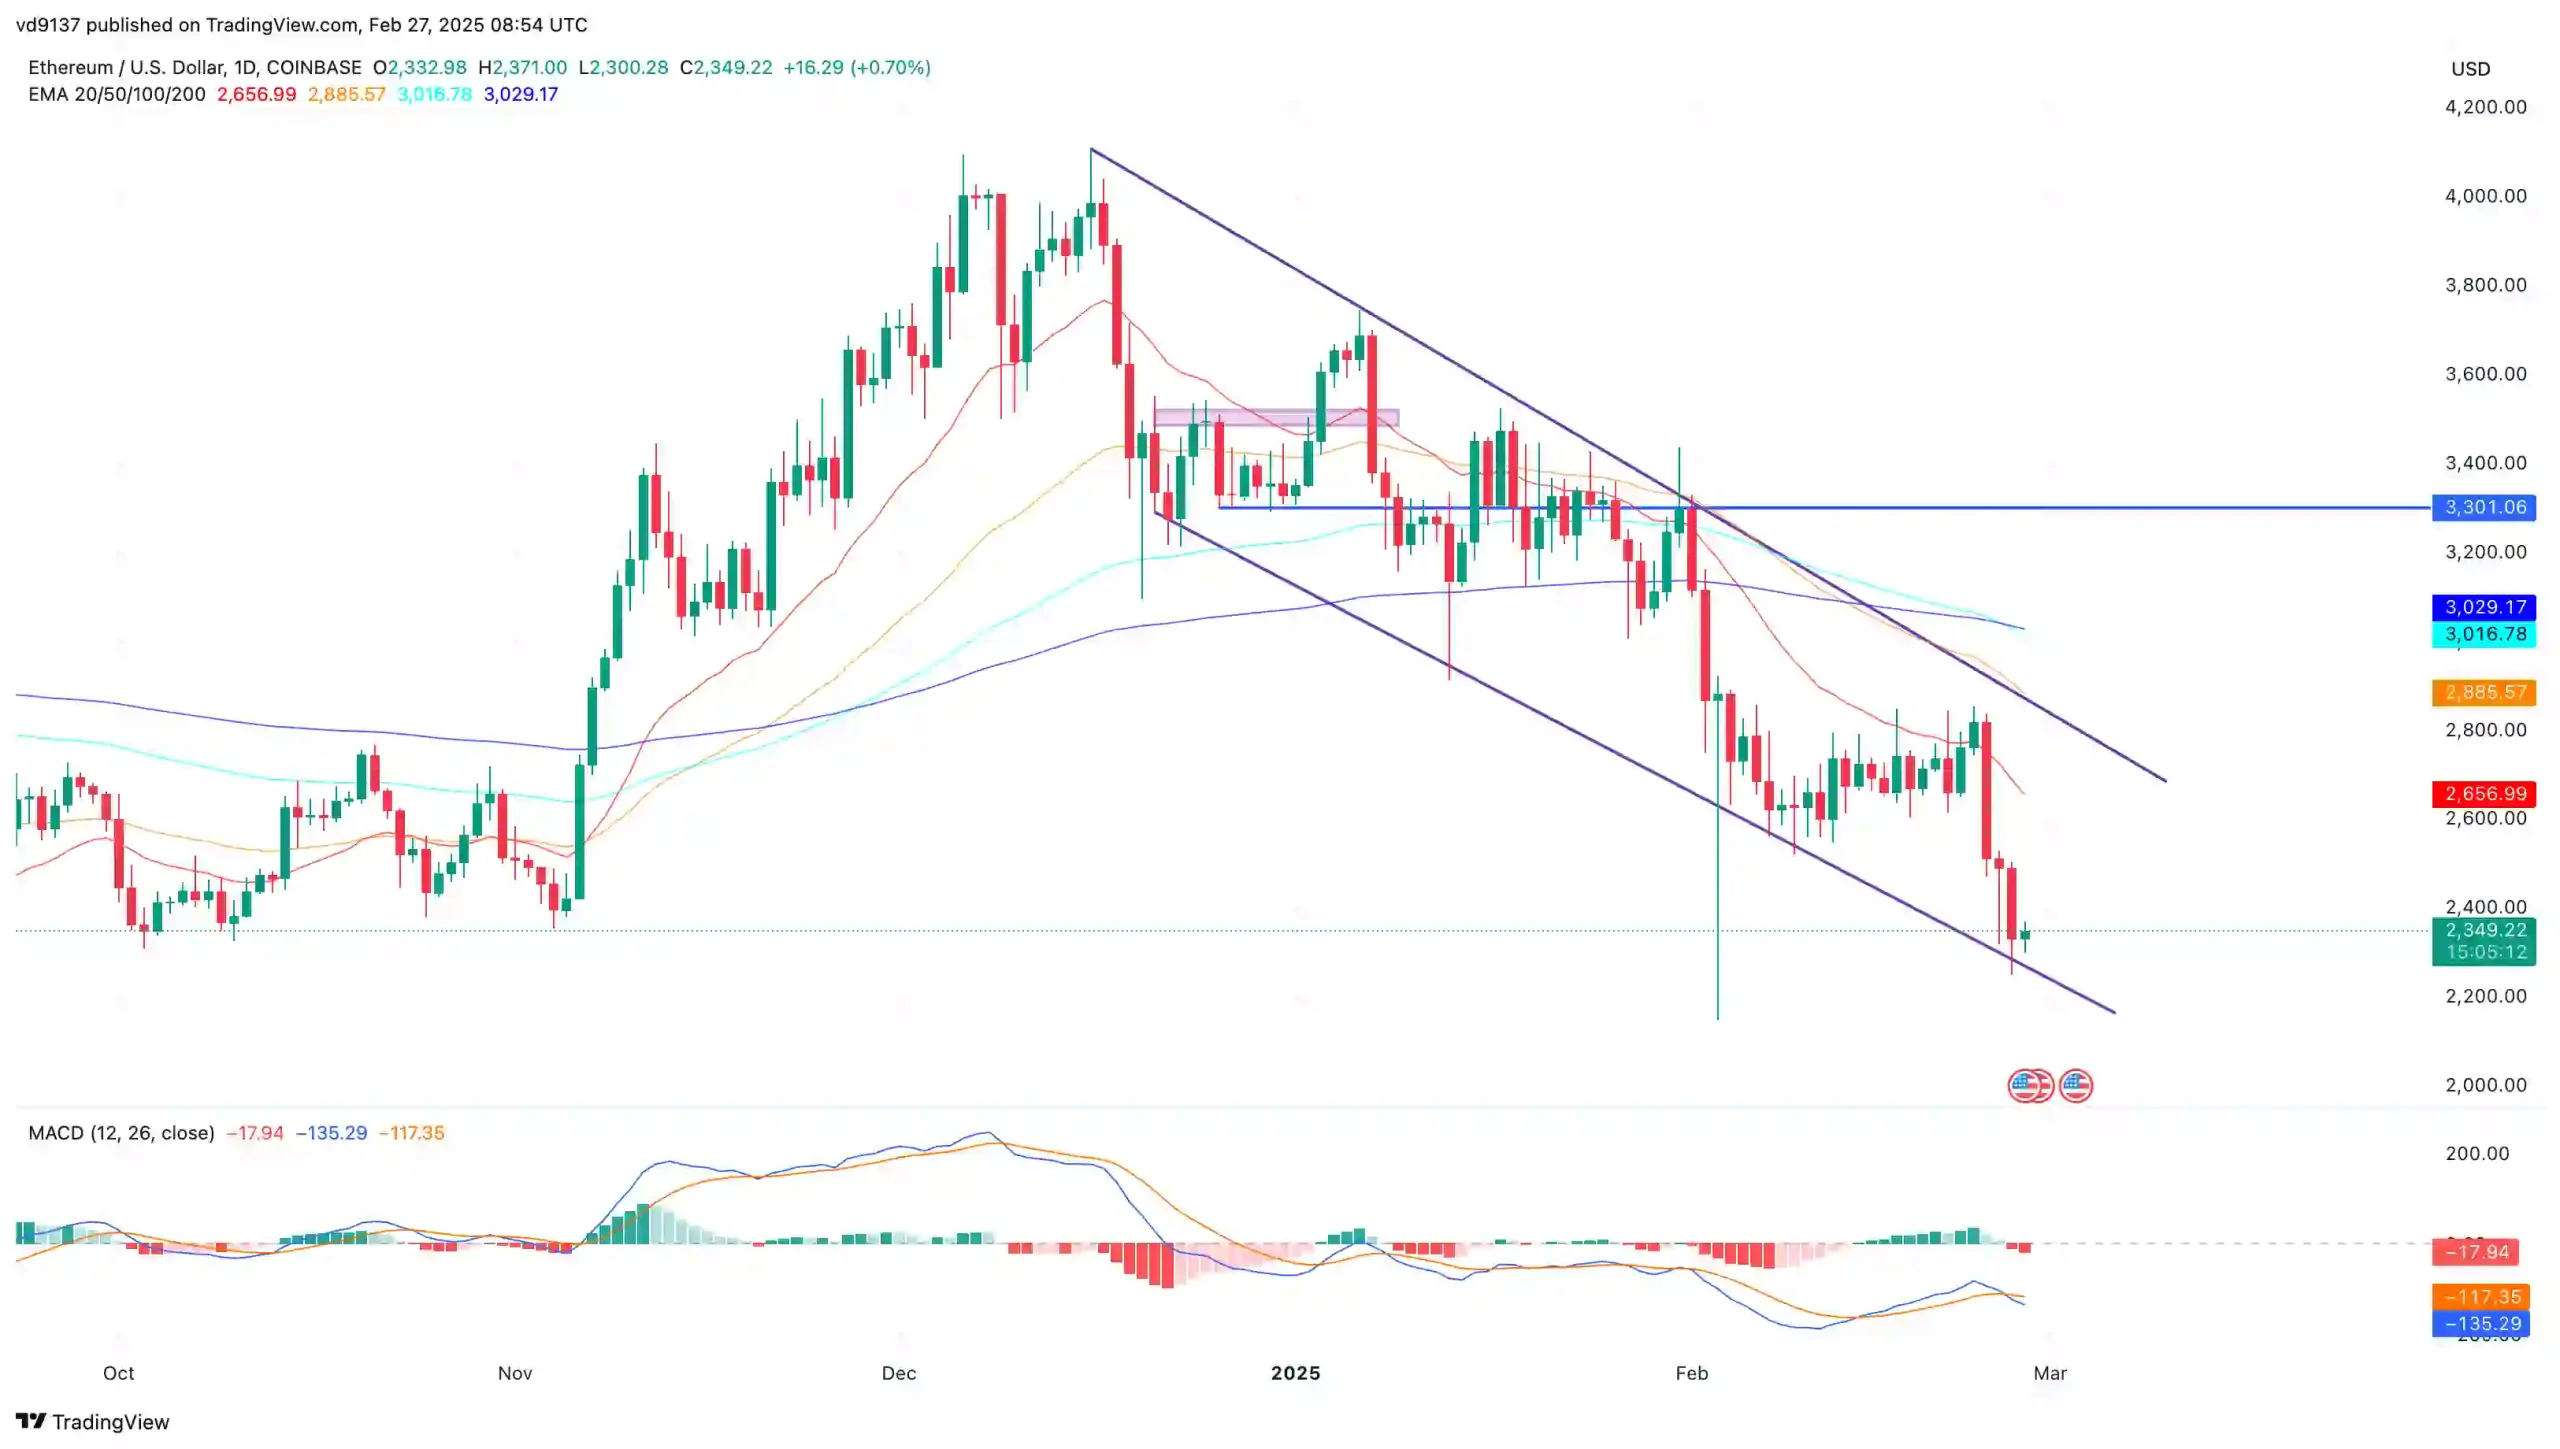
Ethereum Price Chart
With the intraday recovery and multiple lower price rejections, Ethereum is struggling to hold the lower grounds. The price trend has created three consecutive bearish candles, accounting for a nearly 20% drop.
As ETH completes the negative cycle within the channel, a potential rebound is on the way. However, with the broad market conditions, a breakdown rally is highly possible.
Supporting the breakdown chances, the MACD and signal lines have given a negative crossover, with a resurgence of negative histograms.
Furthermore, the 100 and 200-day EMA lines have given a negative crossover, highlighting the increased chances of a breakdown rally.
Ethereum ETFs Record Five Consecutive Day of Outflows
The daily total net inflow of the U.S. Ethereum spot ETFs recorded an outflow of $94.27 million. Out of the nine listed ETH ETFs in the U.S. market, four recorded outflows while four remained with a net-zero flow.
BlackRock led the way with $69.76 million of outflow, with Fidelity offloading $18.38 million worth of Ether. This marks the fifth consecutive day of outflows in the U.S. ETH spot ETFs.
Over the past five days, the ETFs have offloaded nearly $200 million worth of ETH in the market.
Will ETH Price Test $2,000?
As per the daily price chart, the falling selling pattern hints at a potential rebound within the overhead trendline. However, the increased selling momentum and multiple selling triggers are projecting a breakdown rally.
In case of a trendline breakdown, the Ethereum price is likely to test the $2,000 psychological support. However, a bullish recovery will likely test the immediate resistance near the $2,600 mark. Beyond this, the overhead trendline is situated near $2,750.
[ad_2]