
Ethereum is approaching the $2,000 support zone, and the weekly chart points to a possible liquidity sweep before a rebound toward the $3,700 monthly order block. For that scenario to take shape, buyers would need to defend the monthly breaker and drive $ETH back above nearby resistance following its recent slide.
On the Binance $ETH/USDT weekly chart on TradingView, Ethereum was trading around $2,114.95. The current candle printed a low of $2,083.10 and a high of $2,160.50. After a strong run toward $2,700, the price has declined substantially, bringing $ETH closer to the support area highlighted on the chart.
| Support Level Price | Significance |
| Immediate Support | $2,105 first downside level |
| Secondary Support | $2,043 Next support |
| Monthly Breaker | $2,000 potential liquidity sweep |
| Lower Support | $1,983 bearish continuation risk |
Ethereum Approaches $2,000 Monthly Breaker as Sweep Risk Builds
Attention is turning to the $2,000 level as Ethereum drifts toward a monthly breaker sitting just beneath its current price. The zone reflects an earlier market structure, which traders monitor for signs that buying or selling pressure is shifting when price returns to test it.
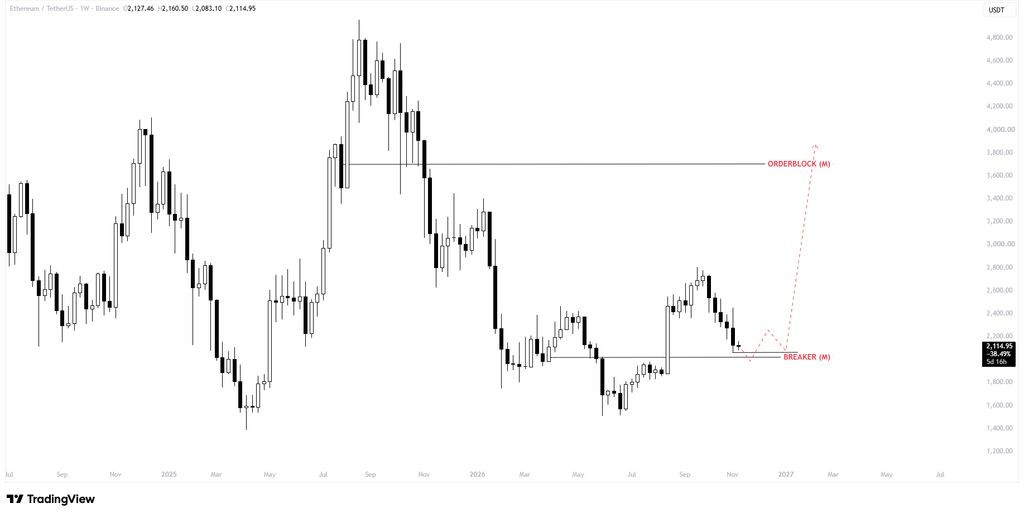
The chart's dashed projection depicts $ETH dipping briefly below the breaker before recovering above it. A move like that could trigger stop orders resting below support, though the illustration does not confirm that such orders exist or that a sweep will happen. A quick reclaim would bolster the bullish case, while prolonged trading below $2,000 would undermine it.
The zone also coincides with a separate technical marker. A November 5 analysis put Ethereum's weekly Supertrend support near $2,008, though it observed that momentum had softened as the price pulled back. That overlap makes the $2,000 area significant, but it does not guarantee a bounce.
Follow us on X for real-time crypto updates.
Ethereum Price Meets Resistance Ahead of the $3,700 Target
Elsewhere, Ethereum's weekly structure is still mixed. The chart shows a recovery from midyear lows near $1,500, a climb toward $2,700, and a subsequent decline. That sequence means buyers would need more than a short-lived support bounce to signal a durable change in trend.
Near-term resistance sits around $2,160 to $2,200, with the broader $2,400 area above it. Clearing that barrier would open the way for a move toward $2,700, which would test the previous rally high. Only after getting through that intermediate structure would the monthly order block near $3,700 become a plausible higher-timeframe target. That objective equates to roughly 75% upside from the chart's $2,115 reference price, and it is not a confirmed forecast.
For now, the suggested liquidity sweep is unconfirmed. The key signal to watch is whether Ethereum rejects prices below the monthly breaker and closes back above support, or instead loses $2,000 and extends its pullback.
Ethereum Resistance Levels
| Resistance Level | Price | Significance |
| Immediate Resistance | $2,165 | First recovery hurdle |
| Secondary Resistance | $2,211 | Bullish confirmation level |
| Major Resistance | $2,400 | Broader recovery barrier |
| Previous Rally High | $2,700 | Higher resistance |
| Monthly Order Block | $3,700 | Extended bullish target |
Bullish Scenario
$ETH could slip below $2,000 before rebounding, since the chart hints at a possible liquidity sweep around the monthly breaker. If buyers push the price back above $2,211, attention would turn to $2,700, with the larger target at $3,700.
Bearish Scenario
Conversely, a break below $2,000 would put the monthly breaker under strain. If $ETH remains beneath that level, $1,983 becomes the next support to monitor, casting doubt on the anticipated recovery.
Neutral Scenario
In the meantime, $ETH may stay wedged between $2,000 and $2,211. Trading inside that band would leave both the bullish recovery and a deeper decline unresolved.
FAQs
1. Can Ethereum Reach $3,700?The $3,700 target remains on the chart, though $ETH would first have to push through nearby resistance.
2. Where Is Ethereum’s Key Support?The monthly breaker near $2,000 is the primary support zone to watch.
3. What Happens If $ETH Falls Below $2,000?A brief dip could sweep liquidity, but continued weakness would bring $1,983 into view.
4. What Resistance Must Ethereum Reclaim?The first hurdle lies near $2,165. Beyond that, traders are eyeing $2,211 and $2,400.
Subscribe to our YouTube channel for the latest crypto news.
Related: XRP Price Analysis: Bearish EMA Crossover Puts $0.9862 Support at Risk
Source: coinedition.com. Adapted by NBTC.
Add A Comment
Comments are closed.