The price of Ethereum (ETH) has continued to rise since breaking through the $3,800 mark. ETH price analysis by Coinidol.com.
Long-term analysis of the Ethereum price: bullish
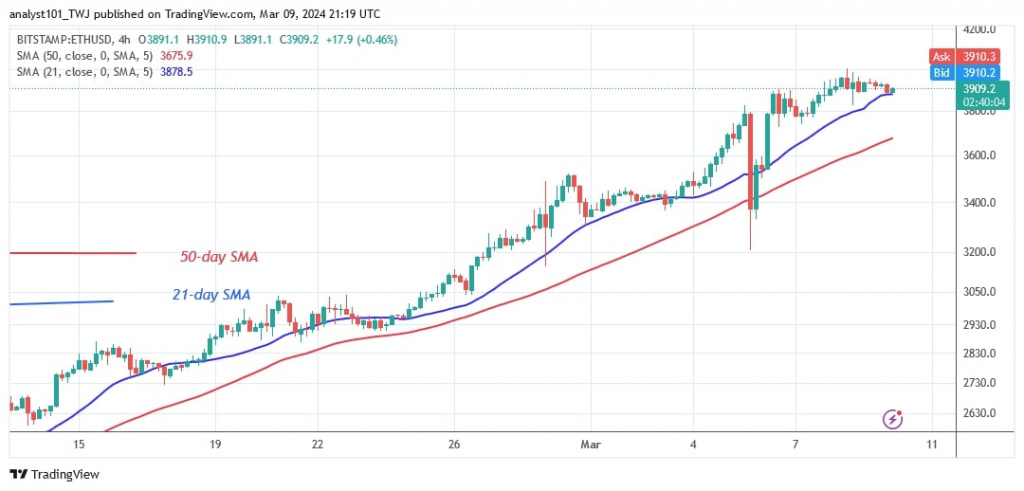
On March 8, the largest altcoin rose and crossed the psychological price threshold of $4,000. The uptrend has stalled below the $4,000 high, the $3,800 support and the 21-day SMA. The largest altcoin has reached the overbought zone of the market. The existence of doji candlesticks has slowed down the price movement. At the time of writing, Ether is valued at $3,909.
On the upside, further upward movement is unlikely due to the dominance of Doji candlesticks. On the downside, Ether will fall if the bears break the 21-day SMA or the support at $3,800. The cryptocurrency will continue to fall and reach a low of $3,600.
Analysis of the Ethereum indicators
The price bars are above and near the 21-day SMA as the market enters the overbought zone. Ether will fall when sellers appear in the overbought zone of the market. The price bars are characterised by the presence of indecisive small-bodied candles known as doji. Traders have entered a phase of hesitation.
Technical indicators:
Key resistance levels – $4,000 and $4,500
Key support levels – $3,500 and $3,000
What is the next direction for Ethereum?
Ethereum is trapped in a narrow range after hitting a high of $4,000 in the altcoin market. On the 4-hour chart, prices have slowly moved above the highs of $3,800 and $4,000. The price of Ether has consolidated above the current support. The price of the cryptocurrency is on the verge of falling below the 21-day SMA. A break below the 21-day SMA would give the bears the upper hand.

Disclaimer. This analysis and forecast are the personal opinions of the author and are not a recommendation to buy or sell cryptocurrency and should not be viewed as an endorsement by CoinIdol.com. Readers should do their research before investing in funds.

