
Ether hovered near $2,900–$2,950 after a pullback from $3,300, as two analysts highlighted the zone as key support. One chart framed the move as a possible Wyckoff last point of support, while another flagged $3,300 and $3,600 as the next resistance levels.
Wyckoff chart flags $ETH support test near $2,900
A chart shared on X by analyst Bitcoinsensus shows Ether trading near $2,920 and labels the recent pullback as a possible “last point of support” in a Wyckoff accumulation setup. The TradingView-style graphic marks prior Wyckoff events on the left side of the cycle, including a selling climax (SC), an automatic rally (AR), and a secondary test (ST), then tracks a long trading range through 2022–2024.
Ethereum Wyckoff Accumulation Chart. Source: Bitcoinsensus on X
More recently, the chart highlights two areas marked “LPS,” including one around the early-2025 base and another near the current zone just below $3,000. The same image draws a horizontal resistance band near the mid-$4,000s, where price previously rejected, and keeps a broader support line lower on the chart around the $1,300 area.
The analyst’s projection sketches a push back toward resistance, then a breakout labeled “SOS” (sign of strength) and a climb toward $5,000 and above. The post frames that outcome as the next phase if Ether holds the current support area and reclaims the upper boundary of the range.
$ETH tests support near $2,950 as traders watch $3,300 resistance
Meanwhile, a daily $ETH/$USDT chart shared on X by That Martini Guy shows Ether trading near $2,950 after a sharp pullback from the $3,300 area. The chart marks $3,300 as a key resistance zone, with a higher supply band near $3,600 where price previously stalled. On the downside, the graphic highlights a support region just above $2,900, which price is currently testing after the latest sell-off.
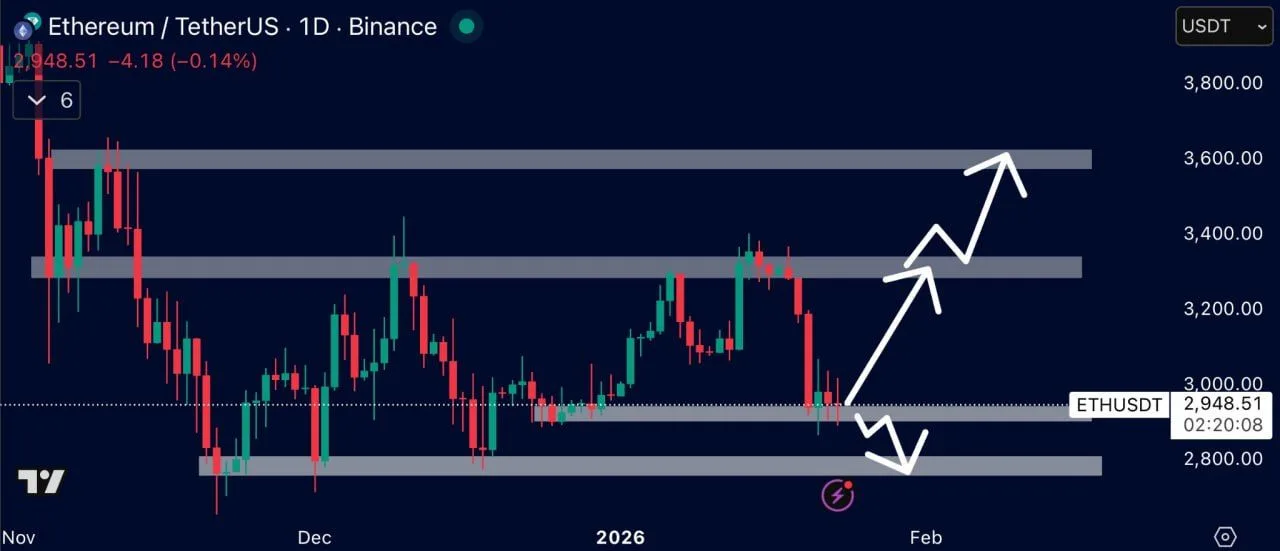
Ethereum $USDT Daily Support and Resistance Chart. Source: That Martini Guy on X
The structure shows Ether moving within a broad range that has defined recent price action. After failing to hold above $3,300, $ETH slid quickly back into the middle of the range, then dipped toward the lower support zone. The analyst’s annotations suggest that a sustained move back above $3,300 would reopen the path toward the $3,600 area, while continued weakness could expose the lower boundary near $2,800.
The chart frames the current level as a decision point. Holding above the $2,900–$3,000 zone would keep Ether inside its established range, while a confirmed break below would shift focus to the next marked support near $2,800. Price at the time of the snapshot sat around $2,948 on Binance, reflecting modest losses on the session.