[ad_1]
According to on-chain analyst Yujin, the Cosmos Network developers transferred 295.3 Bitcoins. It is the first large-scale transfer to be seen in almost two years.
At the current price of $94,410.82, 295.3 Bitcoins (BTC) stand at roughly $27.8 million. Yujin explained that some of the BTC sold in the recent dip are likely from the funds raised around the time of Cosmos’ Initial Coin Offering in 2017 when the project received high-value contributions in BTC and Ethereum (ETH).
时隔近 2 年后,Cosmos Network 开发商转出了 295.3 枚 ($27.7M) 他们在 2017 年通过 ICO 募集的 BTC。https://t.co/dPDd6vMAKB
他们在今年一共转出/出售了 2.16 万枚 ETH 和 295.3 枚 BTC,价值 $7867 万。
他们 2017 年通过 ICO 募集的 BTC 及 ETH 现在还有:96.4 BTC 及 17188 ETH,价值 $6700… https://t.co/MN9iJ6Oul7 pic.twitter.com/6mSblHbjxE
— 余烬 (@EmberCN) December 24, 2024
This new transfer is not the only one that Cosmos developers have made this year, as its team transferred $10.16 million in ETH on Nov. 22 this year. Now, along with the 295.3 BTCs, the developers have sold a total of $78.67 million. However, the developers still hold 96.4 BTC and 17,188 ETH, worth about $67 million at their current market prices.
You might also like: Could Solana dethrone Ethereum? SOL eyes $350 target by 2025
This shows that even after the recent transfers, the team still holds a large amount from its ICO raise. These transactions could be part of an active strategy to make profits as both BTC and ETH have tanked in the last seven days by 11.43% and 14.79%, respectively, as per CoinMarketCap.
Bitcoin in a limbo amid Cosmos sell off
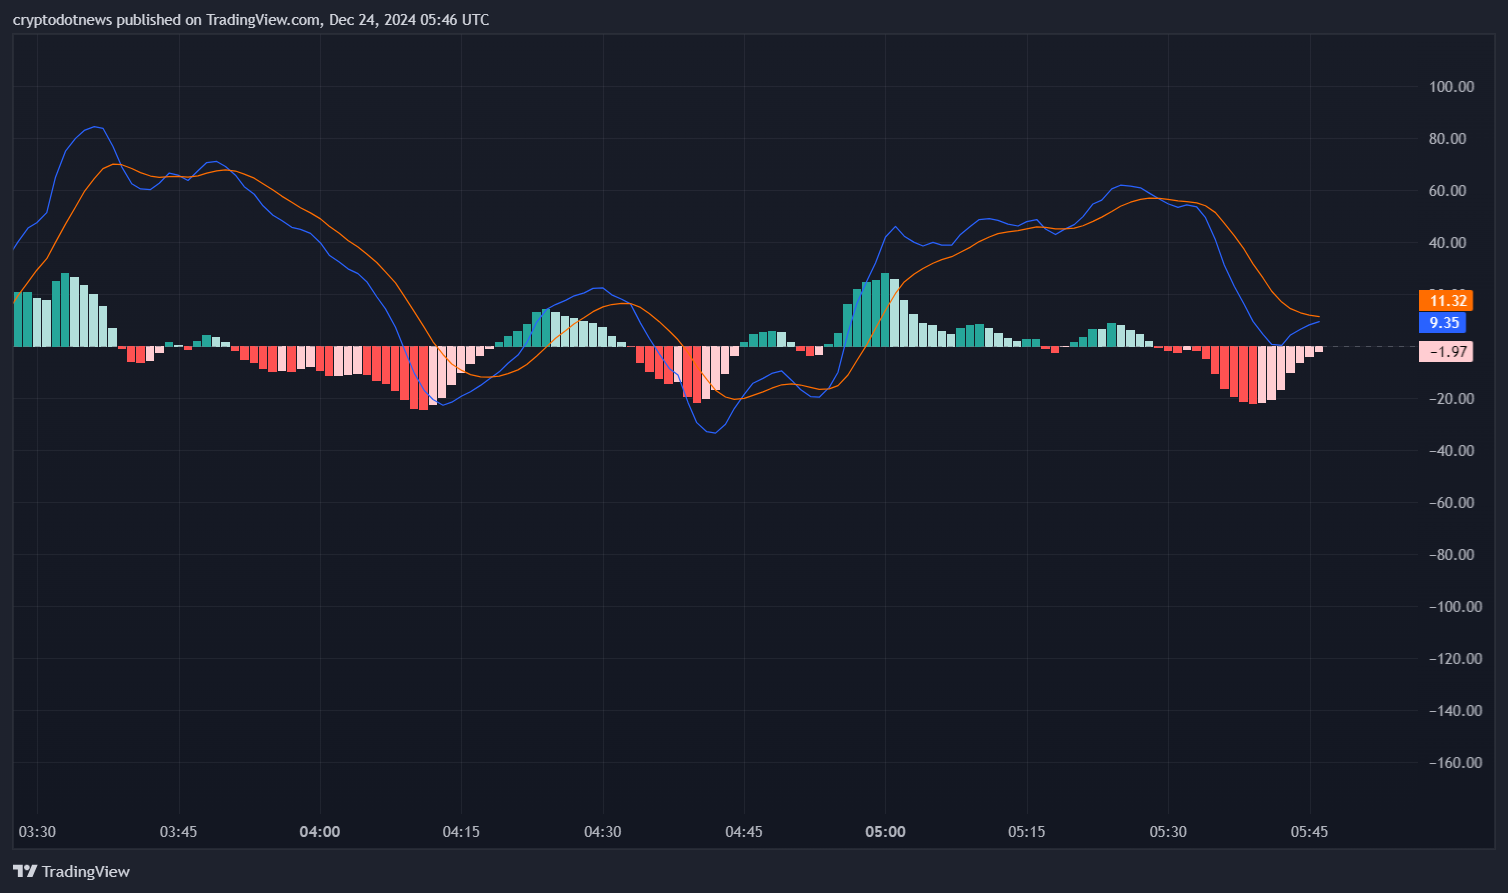
Large-scale BTC sales should increase market selling pressure, which might send prices lower when demand does not keep up. Sales of this scale, especially in low liquidity markets, can sometimes overwhelm buyers and send the price lower. This tends to be worsened by traders selling before further drops occur, as well as creating additional selling pressure. This can be further seen in the Moving Average Convergence Divergence analysis which helps discover an asset’s price trends and reversals by examining moving averages and momentum.

The MACD chart for Bitcoin as of December 24, 2024, showing a recent bearish crossover with negative histogram values, indicating potential downward momentum. Source: TradingView by crypto.news
You might also like: Charts of the week: HYPE, BGB and MOVE rally in double-digits, Bitcoin crash does not fade gains
The BTC/USD chart shows the bearish crossover with the MACD indicator, which has also moved above its signal line – generally a sign that downward momentum may lie ahead. Also, the histogram crosses below zero to compound this interpretation, marking an upsurge in selling pressure. On the other hand, BTC could go back toward previous highs. There could be a bullish reversal of the going trend if the MACD line crossovers the signal line.
A crossover like that would point to an insurgence of demand and a positive change in attitude, which could push the price higher along with momentum from other market participants. At the moment, it looks like BTC is in a “do or die” situation where anything can happen with both signal and MACD line merging, with no potential price direction.
Read more: MicroStrategy enlarges Bitcoin coffers by $561m
Disclosure: This article does not represent investment advice. The content and materials featured on this page are for educational purposes only.
[ad_2]

