[ad_1]
Bitcoin price made its debut above $50,000 for the first time since December 202, topping out at $50,400. The upswing in price comes on the backdrop of immense interest in the recently launched spot BTC ETFs.
Speculators are banking on this positive trend, channeling more money into the markets to keep Bitcoin moving to higher levels, with a local top anticipated at $55,000 before the halving due in April.
How BTC ETFs Pump Bitcoin Price
The cumulative total net inflow volume in the new spot ETF sector reached $3.26 billion on February 12, as seen on SoSoValue. Backing the impressive influx of funds has been an average of $500 million single-day total net inflow, for three days in a row.
So far, BlackRock’s IBIT ETF is the best-performing asset, accounting for more than half of the daily total net inflow, considering the $374 million recorded on Monday.
On the other side of the fence, Grayscale’s GBTC leads from behind with a negative net inflow of $95 million followed by BTCO at -$21 million net inflow.

Bitcoin ETF data | SoSoValue
It is slightly over a month since spot Bitcoin ETFs were approved implying that their impact could be astronomical in the long run. Institutional investors who previously avoided Bitcoin and crypto due to the complexity of the market are now turning to the new investment vehicle.
This is also a sign that Bitcoin is maturing as a global asset, Michaël van de Poppe, the founder of MN Trading Consultancy said via a post on X.
The last three trading days the net inflow has equalled to $+1.5B.
Every day +$500M has been flowing into the markets through the Spot #Bitcoin ETFs.
That’s a huge sign.
Institutions are interested, Bitcoin is getting mature, this market is going to accelerate.
— Michaël van de Poppe (@CryptoMichNL) February 13, 2024
Bitcoin Price Prediction: Navigating The Bullish Technical Structure
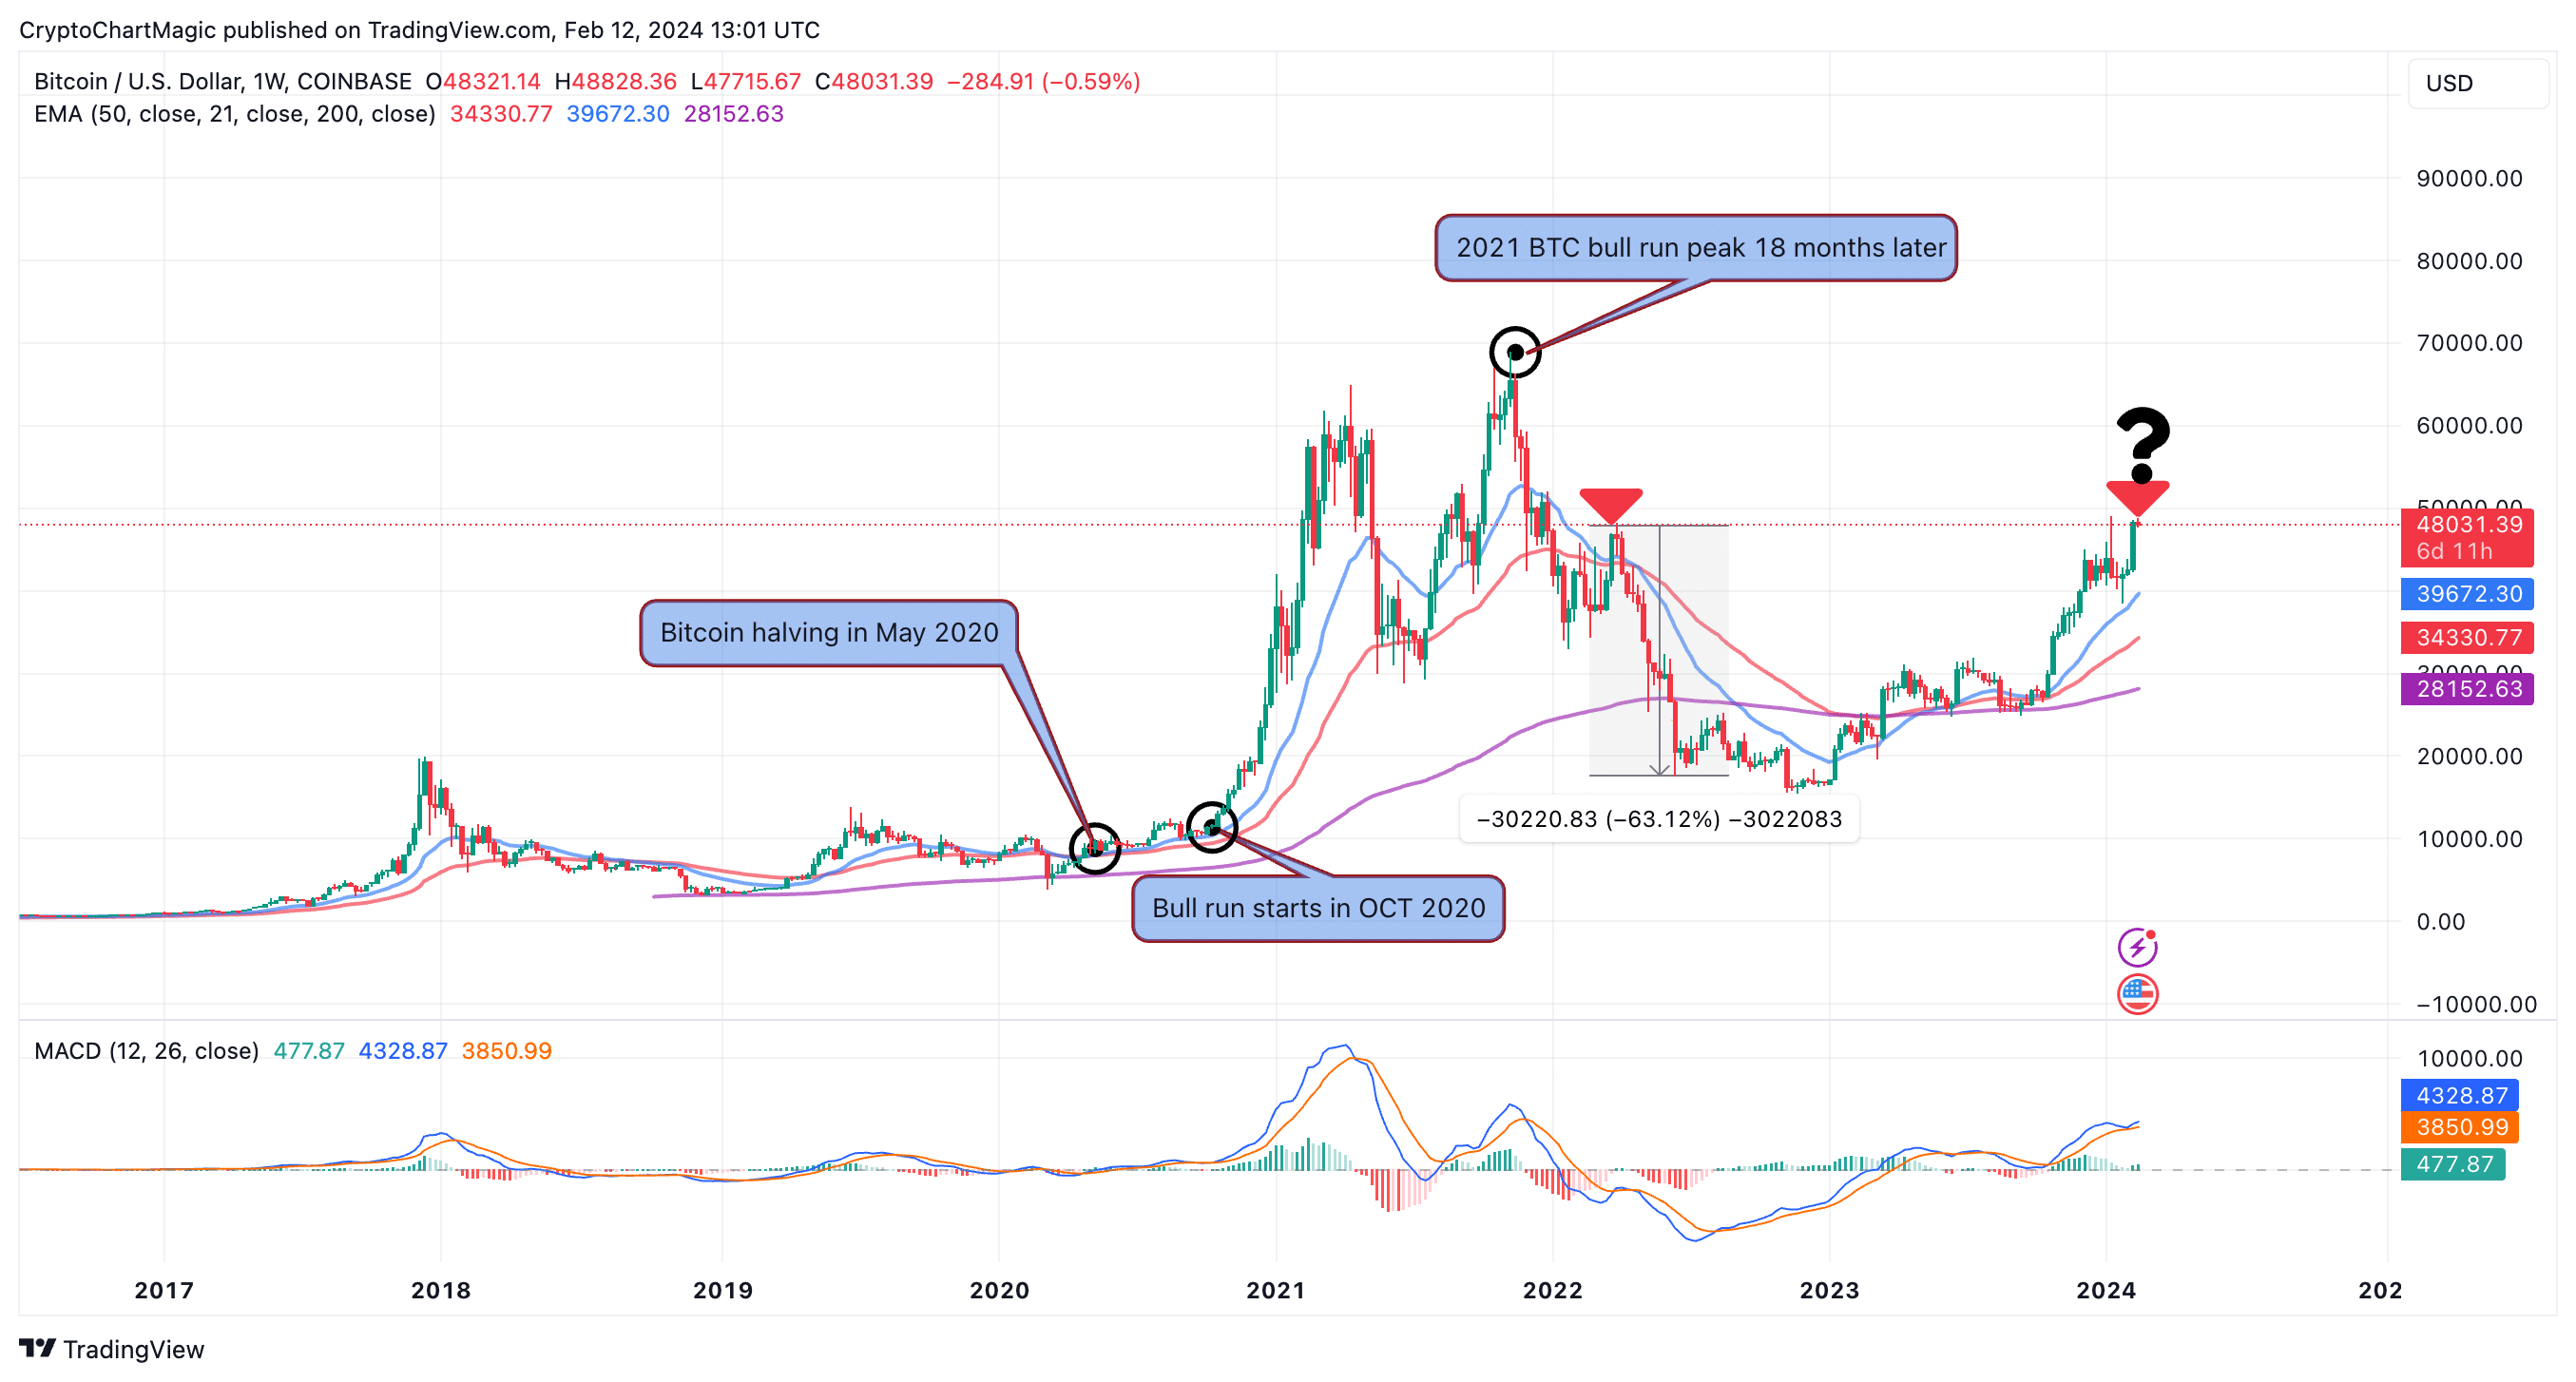
The break above $50,000 comes as a direct impact of the surge in spot ETF volume. However, the Monday high resistance at $50,400 is an area of interest for intraday traders as it has to be successfully tested to affirm Bitcoin price trajectory to $52,000. This is another key area to watch, considering it is a big weekly resistance from December 2021 — at the start of the bear market.
Due to the high volatility in the market, Bitcoin ceded ground below $50,000 on Tuesday and traded at $49,905 during the American session.
Despite the correction, the Relative Strength Index (RSI) backs the bullish technical structure on the weekly chart. Should BTC close the day above $50,000, confidence in the uptrend is bound to grow, thus building momentum.
In the short-term, some of the key milestones to look forward to are the pivotal level at $50,000, resistance at $50,400, and the subsequent seller congestion zone at $52,000.

Bitcoin price chart | Tradingview
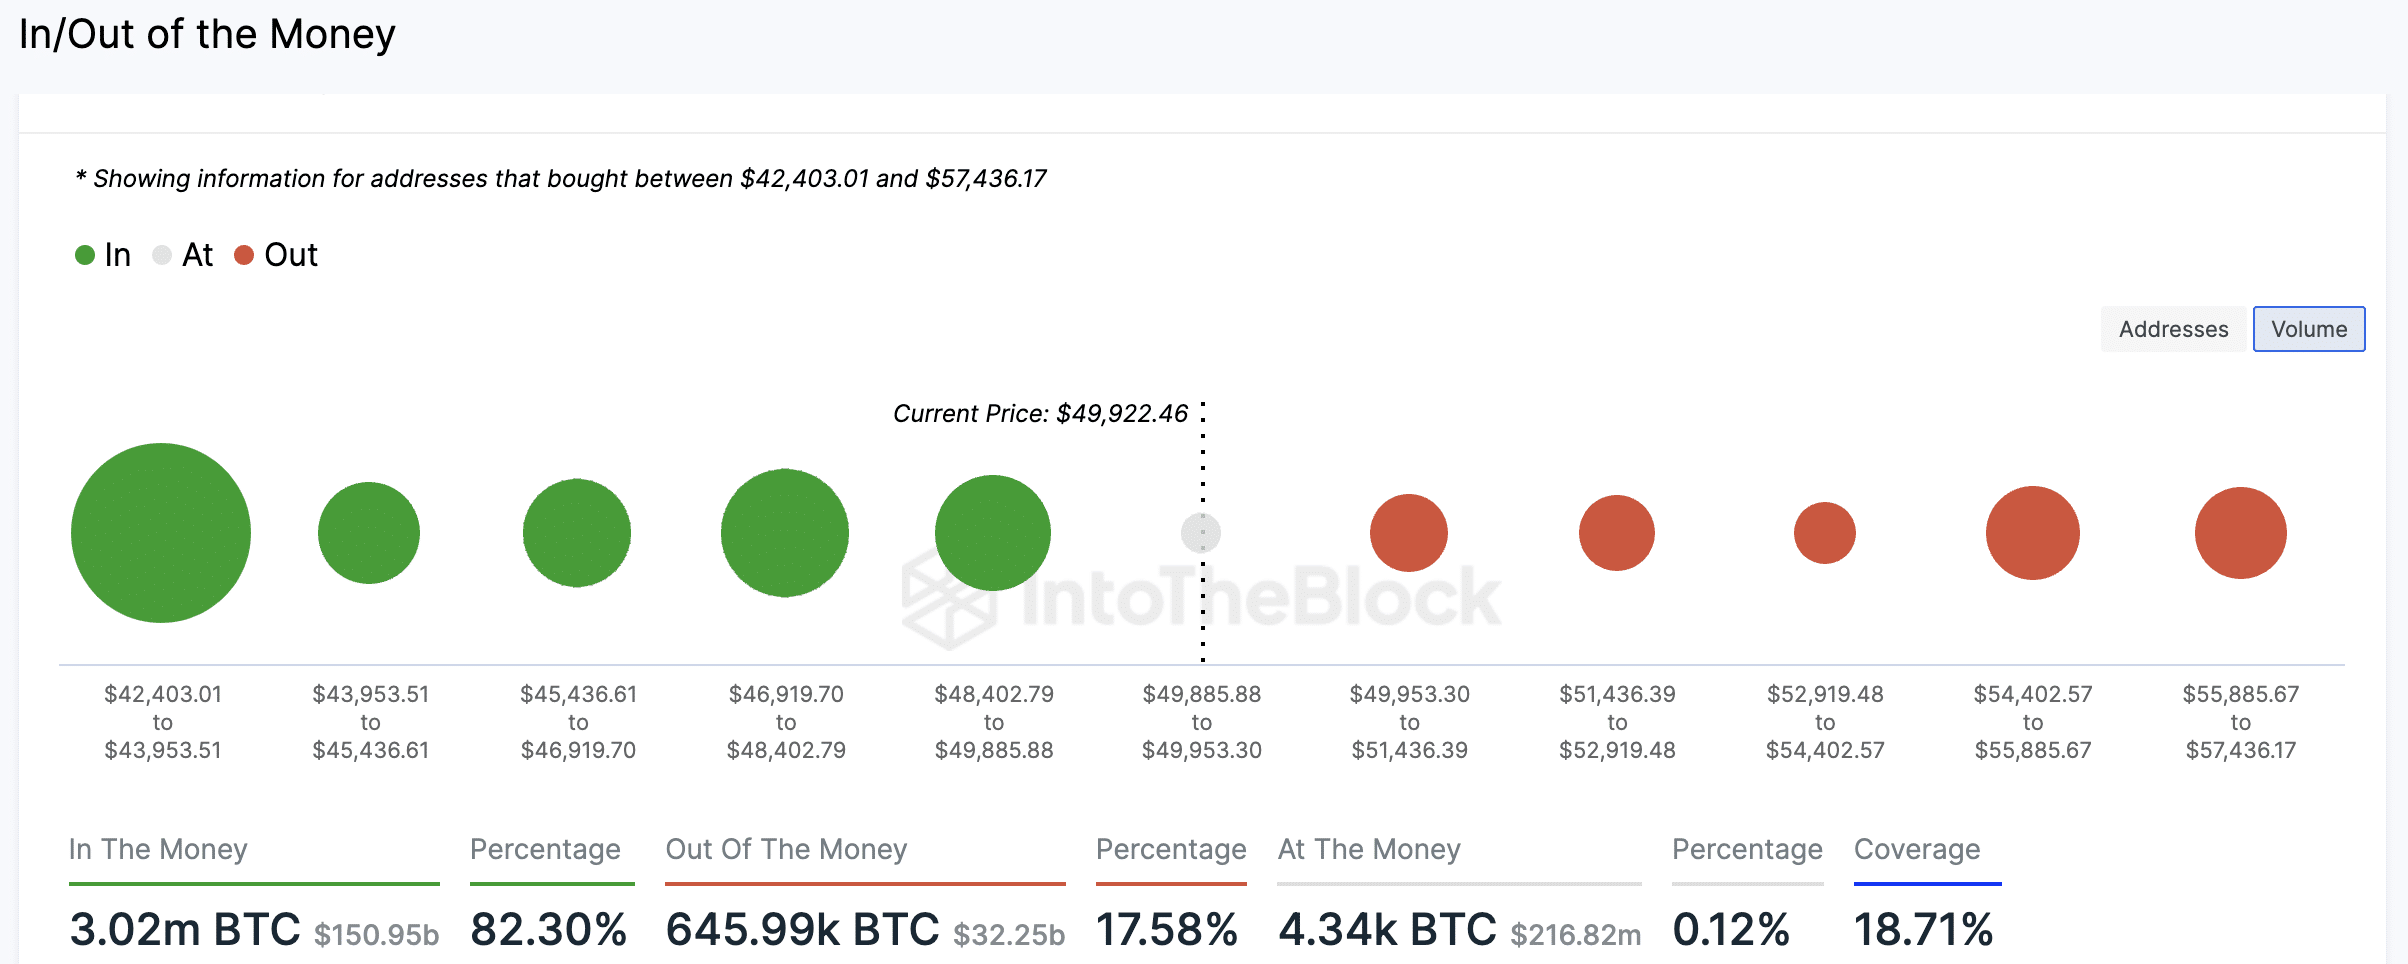
Based on the fundamental structure, graphically presented by IntoTheBlock, Bitcoin price has a relatively smooth path to $55,150, where 475k addresses purchased 207 BTC. Investors may choose to sell after breaking even on their positions, increasing the pressure on BTC and perpetuating another retracement.

Bitcoin S/R Areas | IntoTheBlock
Although the bellwether crypto boasts several support areas up its sleeve, the biggest lies between $42,403 and $43,953. In this range, 3 million addresses bought 1.44 million BTC. In case of of massive pullback, Bitcoin is unlikely to drop beyond this support area.
Related Articles
- MicroStrategy’s $3.2B Bitcoin Profits Boost Bitcoin Confidence Amid Halving Speculation
- XRP Whales Accumulate Over 250 Mln Tokens From Binance As Price Nears $0.53
- Shiba Inu Burn Jumps 70% With 27 Mln Tokens Burnt, SHIB To Hit $0.00001?
[ad_2]

