Ethereum’s price has been gradually declining after the rejection from the $4,000 resistance level.
Yet, things might finally change soon as the asset bounced off the $3,000 support.
Technical Analysis
By Edris Derakhshi (TradingRage)
The Daily Chart
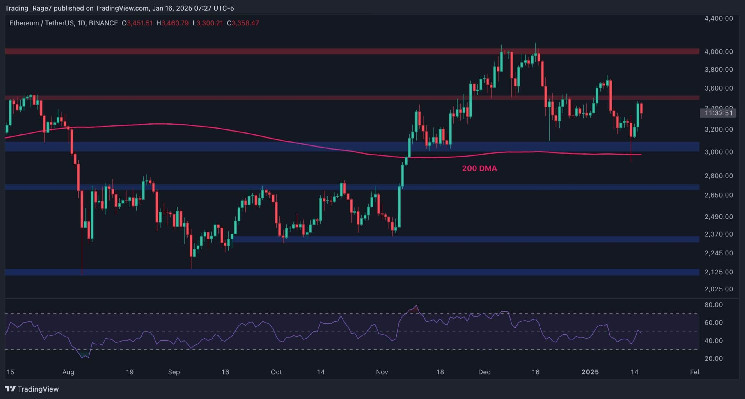
On the daily chart, the asset has been making lower highs and lows over the past few weeks after getting rejected from the $4,000 resistance zone. The $3,500 level has also been lost, as the market has corrected all the way back to $3,000 and the 200-day moving average, located around the same price mark.
Yet, this level has supported the largest altcoin, pushing it back higher to retest the $3,500 level. If the market can break above this area, a rally toward the $4,000 resistance zone would be expected.
The 4-Hour Chart
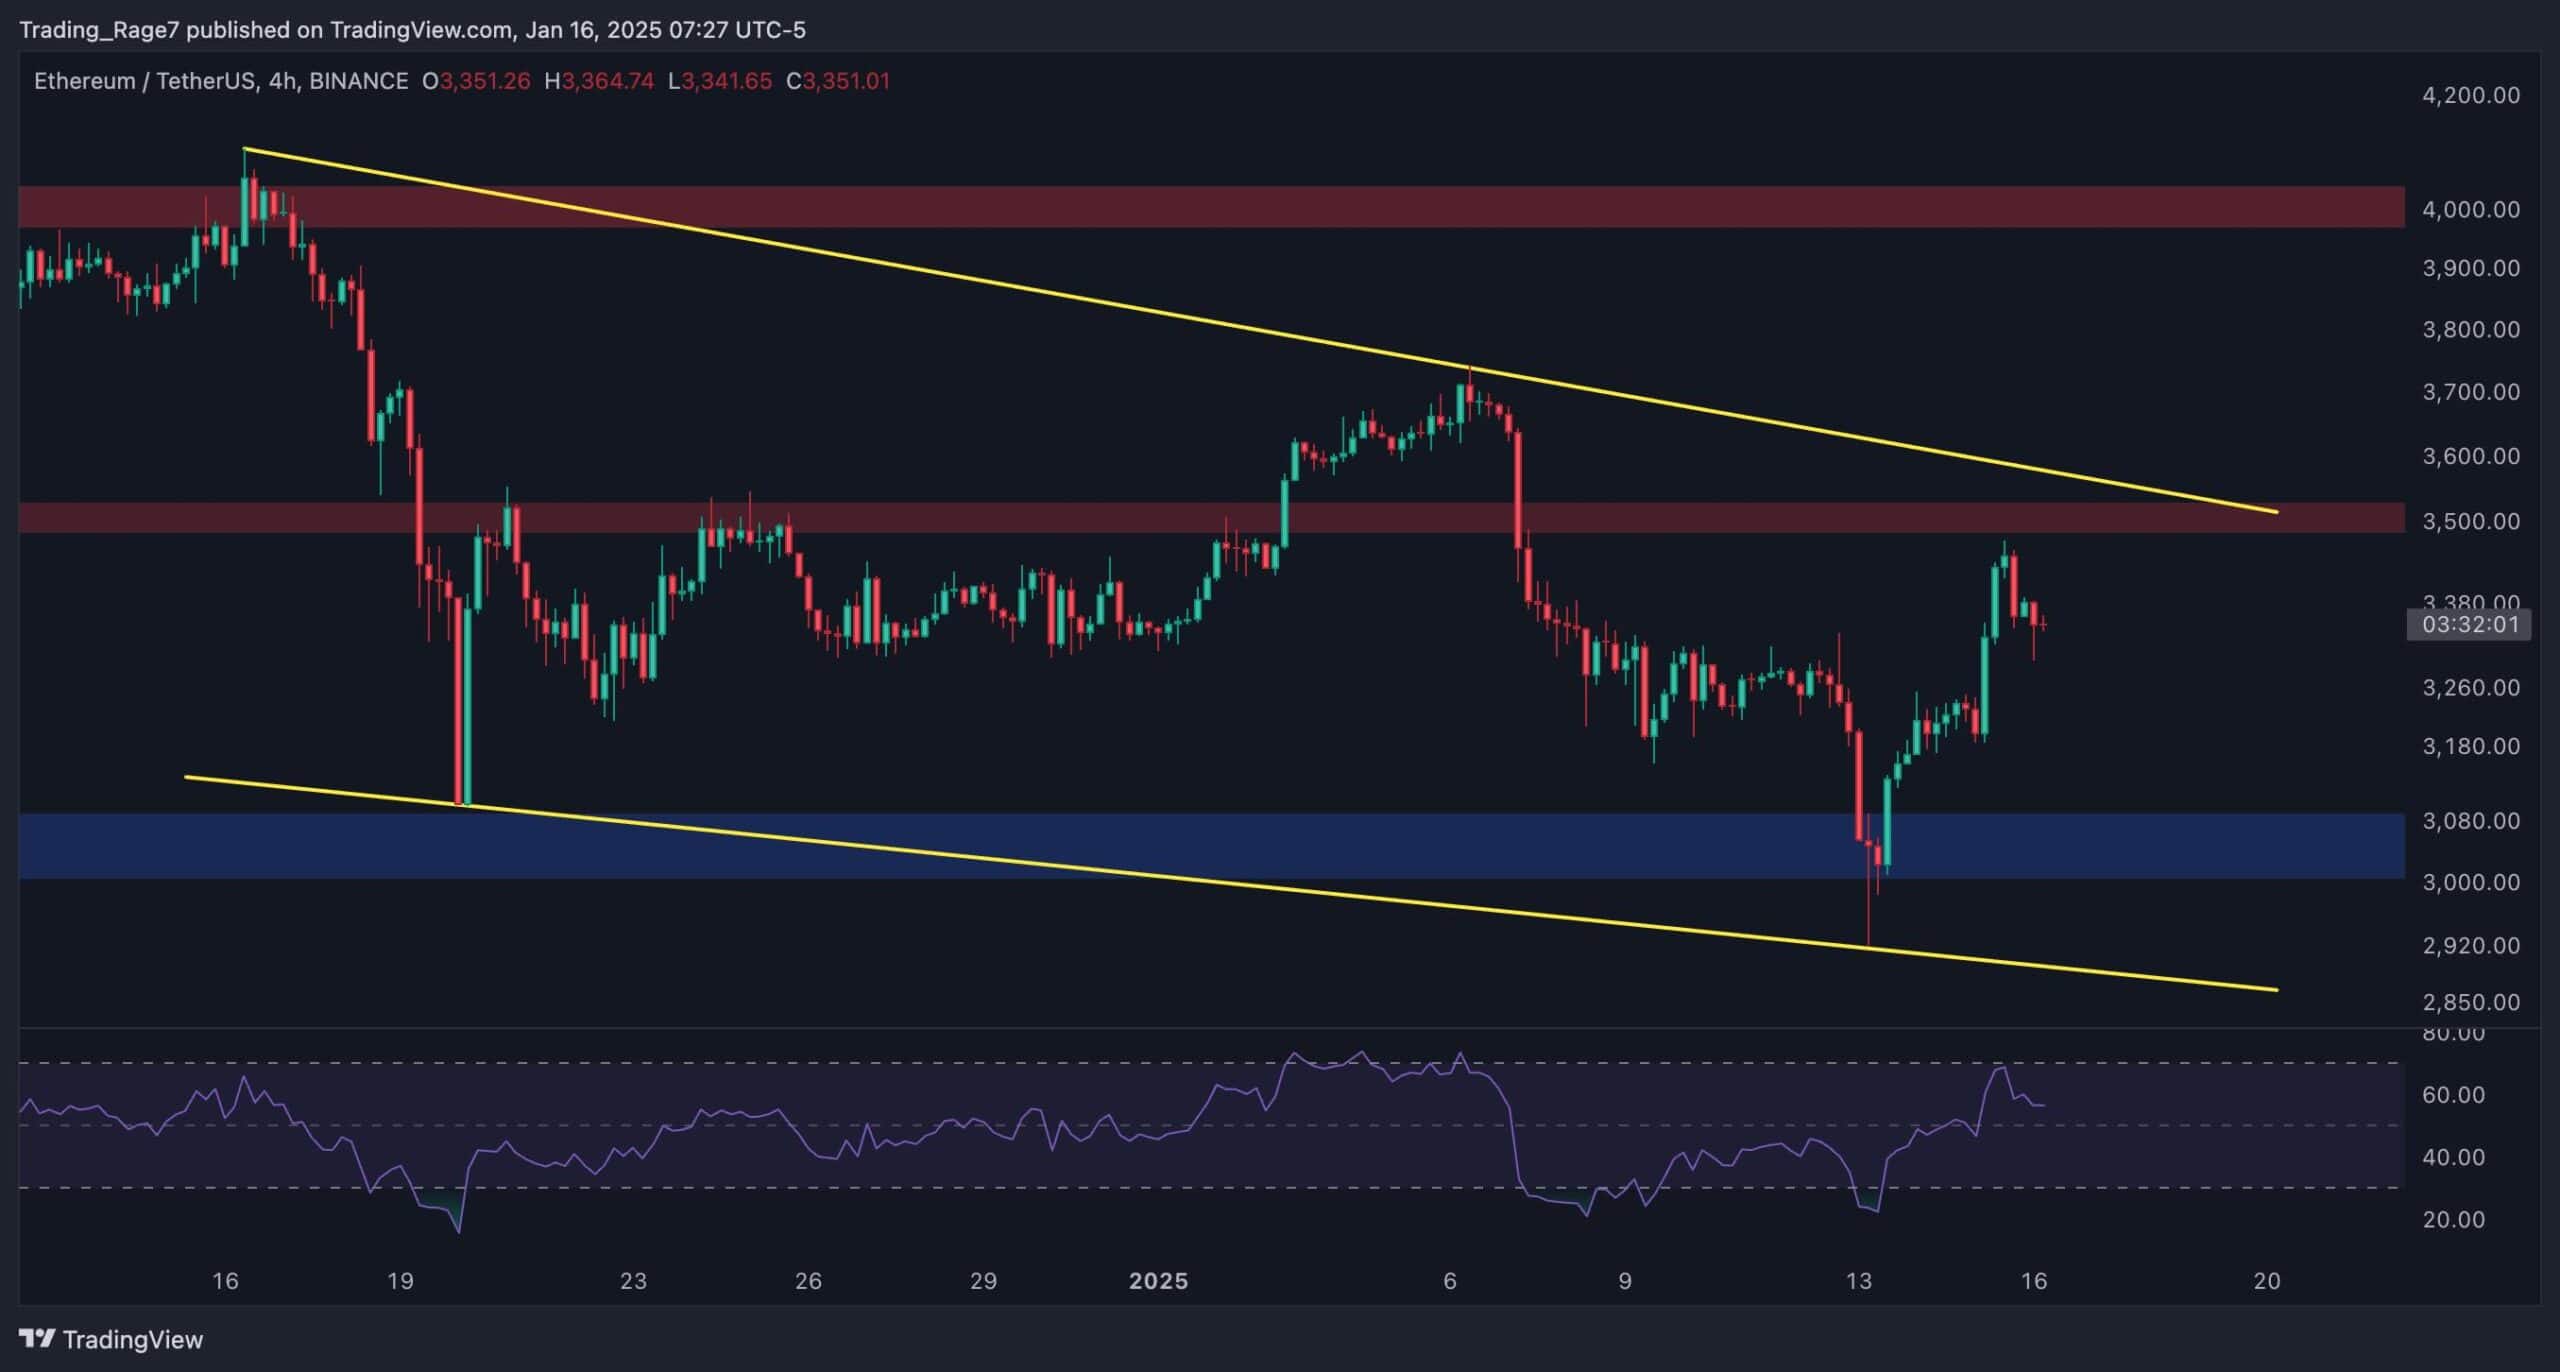
Looking at the 4-hour timeframe, ETH has been forming a descending channel over the past few weeks. With the market already rebounding twice from the lower trendline, the price is now bound to test the higher boundary of the pattern.
With the RSI also showing values above 50%, the momentum is in favor of a bullish continuation above the pattern and potentially toward the $4,000 area.

Sentiment Analysis
By Edris Derakhshi (TradingRage)
Ethereum Open Interest
Ethereum’s price has been going through a correction over the last month, and investors are wondering whether a sustainable rally will soon come or whether more volatility and uncertainty could be expected.
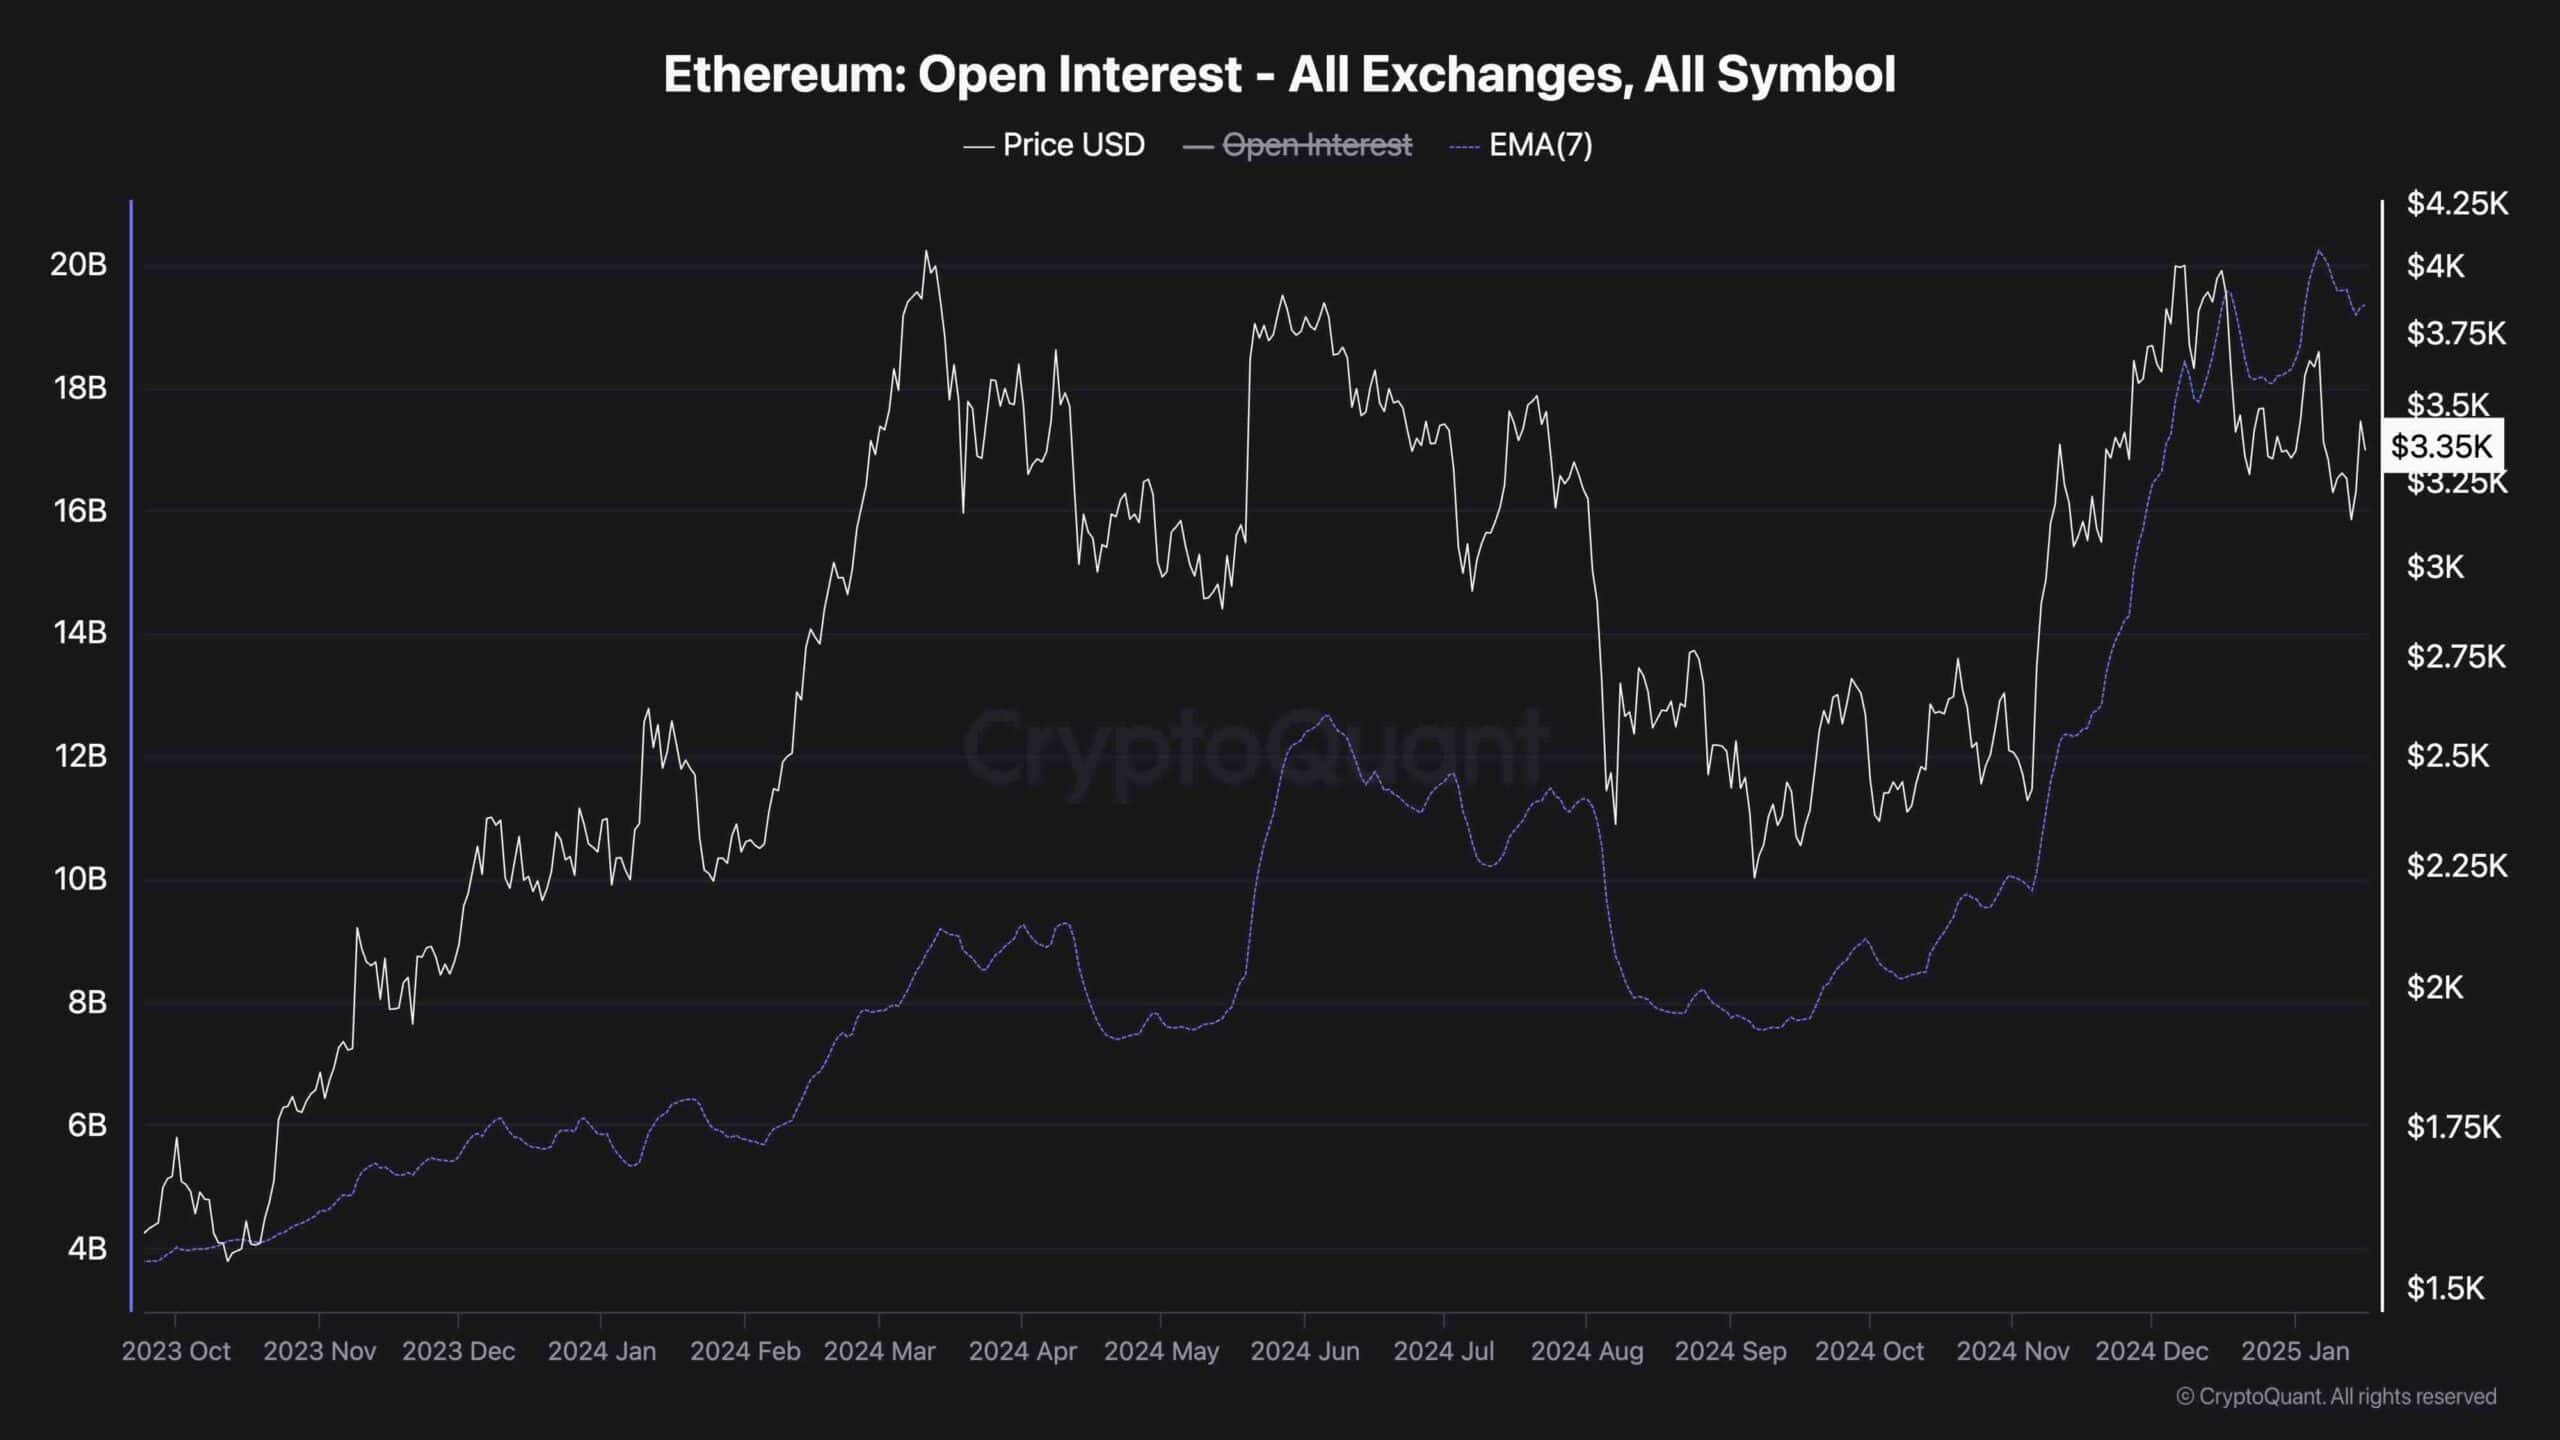
This chart presents the open interest metric, which measures the number of open futures contracts across all exchanges. Higher values are usually associated with more volatility as the risk of rapid liquidation cascades increases.
The chart demonstrates that the open interest metric has been rising consistently over the recent weeks. This suggests that more liquidations could still be expected, and the volatility has yet to decrease.

