
[ad_1]
As of May 20, 2024, bitcoin is trading at $67,224, reflecting a strong market performance. The cryptocurrency has experienced a 24-hour range between $66,000 and $67,431, with a market capitalization of $1.32 trillion and a trading volume of $21.18 billion.
Bitcoin
The daily chart indicates that bitcoin (BTC) is in a prolonged uptrend, having recently reached a high of $67,654. Key support is observed at around $56,500, a level tested during the most recent dip. Despite the strong bullish momentum signaled by multiple large upswings, there is noticeable selling pressure near the recent highs, as evidenced by the dips that followed. Volume fluctuations align with significant price movements, suggesting active market participation.
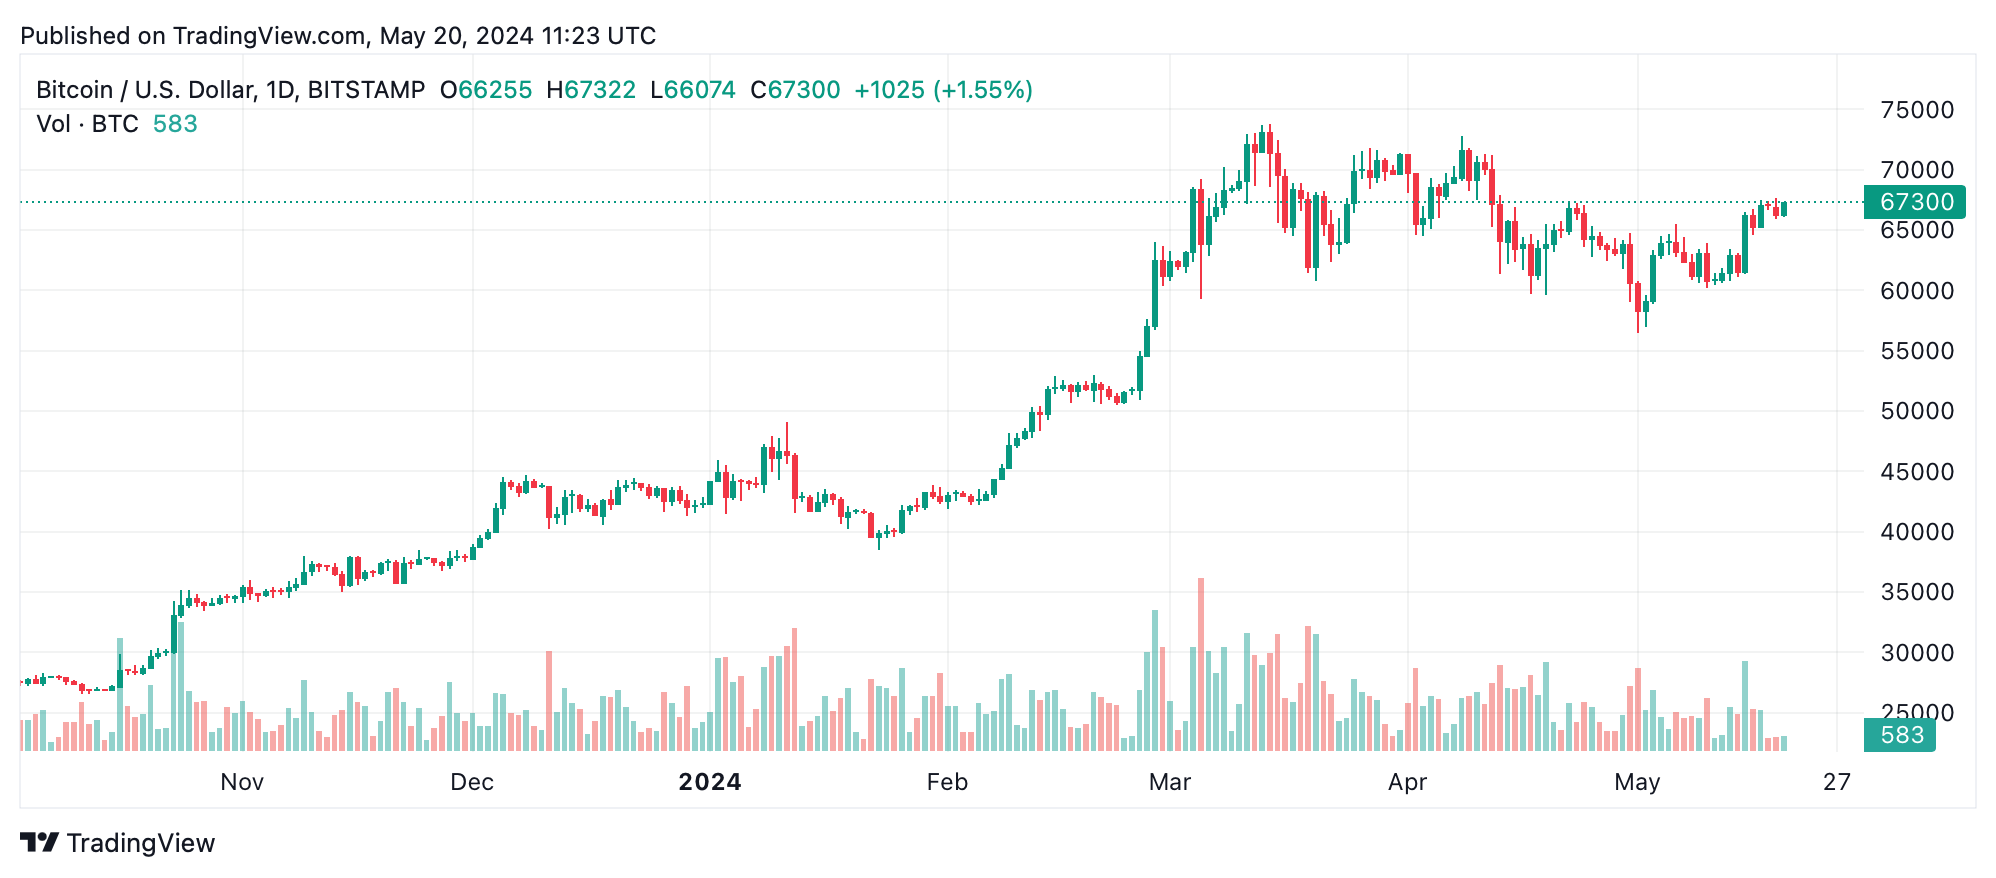
BTC/USD daily chart.
On the 4-hour chart, bitcoin’s price action reveals a strong uptrend from $61,322 to $67,654, followed by a period of consolidation. Support is solidified around $65,500, while resistance remains at $67,654, consistent with the daily chart. The mix of ups and downs during consolidation indicates market indecision, though recent upticks suggest the potential for bullish continuation. Increased volume during significant price movements further corroborates this trend.
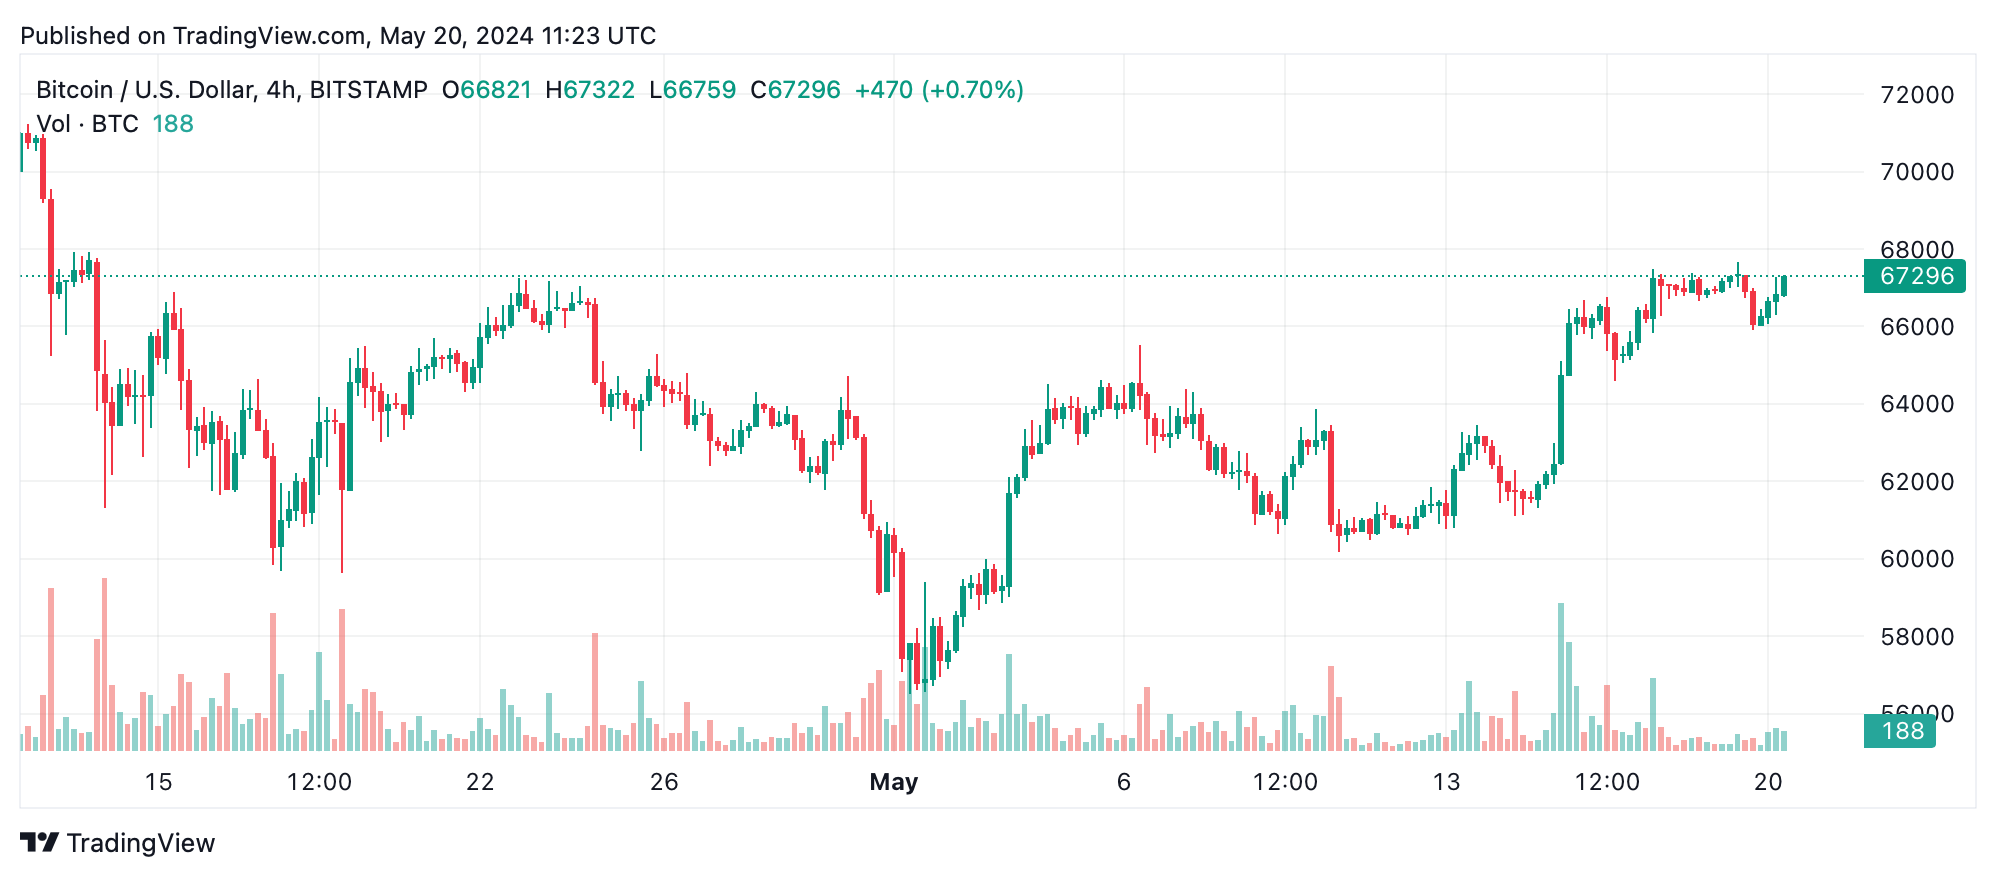
BTC/USD 4-hour chart.
The hourly chart presents a short-term uptrend within the broader trend, with a recent pullback to $65,901 before recovery. Support at $65,901 aligns with the level where the dip was bought up, reinforcing its significance. Resistance remains at $67,654, a critical level across all timeframes. The presence of several drops followed by some upswings indicates a potential reversal.
Analyzing the oscillators, the relative strength index (RSI) at 58 points to a neutral market stance. The Stochastic is at 89, also reflecting neutrality. However, the commodity channel index (CCI) at 122 suggests a sell signal, indicating potential overbought conditions. The average directional index (ADX) at 21 denotes a weak trend, while the awesome oscillator, with a value of 3103, remains neutral. Notably, the momentum oscillator at 6389 and the moving average convergence divergence (MACD) level at 682 both suggest a buy signal, indicating upward momentum.
The moving averages (MAs) paint a predominantly bullish picture. Both the exponential moving averages and simple moving averages across 10, 20, 30, 50, 100, and 200 periods indicate buy signals. The EMA at $65,222 and the SMA at $64,568 support the current price level, reinforcing the bullish outlook. The longer-term averages, such as the EMA (200) at $53,971 and the SMA (200) at $52,316, further underpin this positive trend, suggesting strong support levels well below the current price.
Bull Verdict:
Given the strong upward trends observed in both short-term and long-term charts, supported by multiple buy signals from moving averages and momentum oscillators, the overall outlook for bitcoin remains bullish. Traders should watch for a breakout above the $67,654 resistance level, which could signal further price increases.
Bear Verdict:
Despite the prevailing bullish sentiment, some caution is warranted due to neutral signals from several oscillators and the potential for selling pressure near current highs. Should bitcoin fail to break above the $67,654 resistance, a pullback to the support level around $65,500 or lower is possible, indicating potential bearish pressure.
[ad_2]