
Bitcoin maintained a price of $94,317 as of April 26, 2025, with a market capitalization of $1.87 trillion and a 24-hour trading volume reaching $21.12 billion. Throughout the last day, bitcoin fluctuated within a range of $94,033 to $95,857, suggesting a tense balance between bullish momentum and growing resistance.
Bitcoin
Bitcoin’s price action on the daily chart underscores a dominant uptrend that originated from a bottom around $74,434. The rally toward the $95,000 mark has been characterized by expanding trading volume, a hallmark of genuine bullish conviction. Support on the daily timeframe is anchored in the $88,000 to $90,000 region, while immediate resistance sits near the intraday high of $95,857. Oscillator readings, such as the relative strength index (RSI) at 68 and the average directional index (ADX) at 25, convey a neutral stance, indicating the trend’s strength remains intact but not extreme. The commodity channel index (CCI) at 146 and Stochastic at 92, both signaling negative conditions, suggest caution is warranted as bitcoin navigates near key resistance levels.
BTC/USD daily chart via Bitstamp on April 26, 2025.
The 4-hour chart reveals a methodical stair-step progression, punctuated by small periods of consolidation after each surge higher. Currently, bitcoin is undergoing a mild correction from its $95,857 peak, accompanied by declining volume—an early warning of potential volatility ahead. A critical support area has formed around $93,500, with resistance just under $95,800. Oscillator insights on this timeframe indicate the market may be approaching exhaustion, as momentum cools and price movement compresses into a rising wedge structure. Should the price break decisively below support, a short-term retracement may accelerate, but if it sustains strength, a renewed breakout could target the $97,000 area.
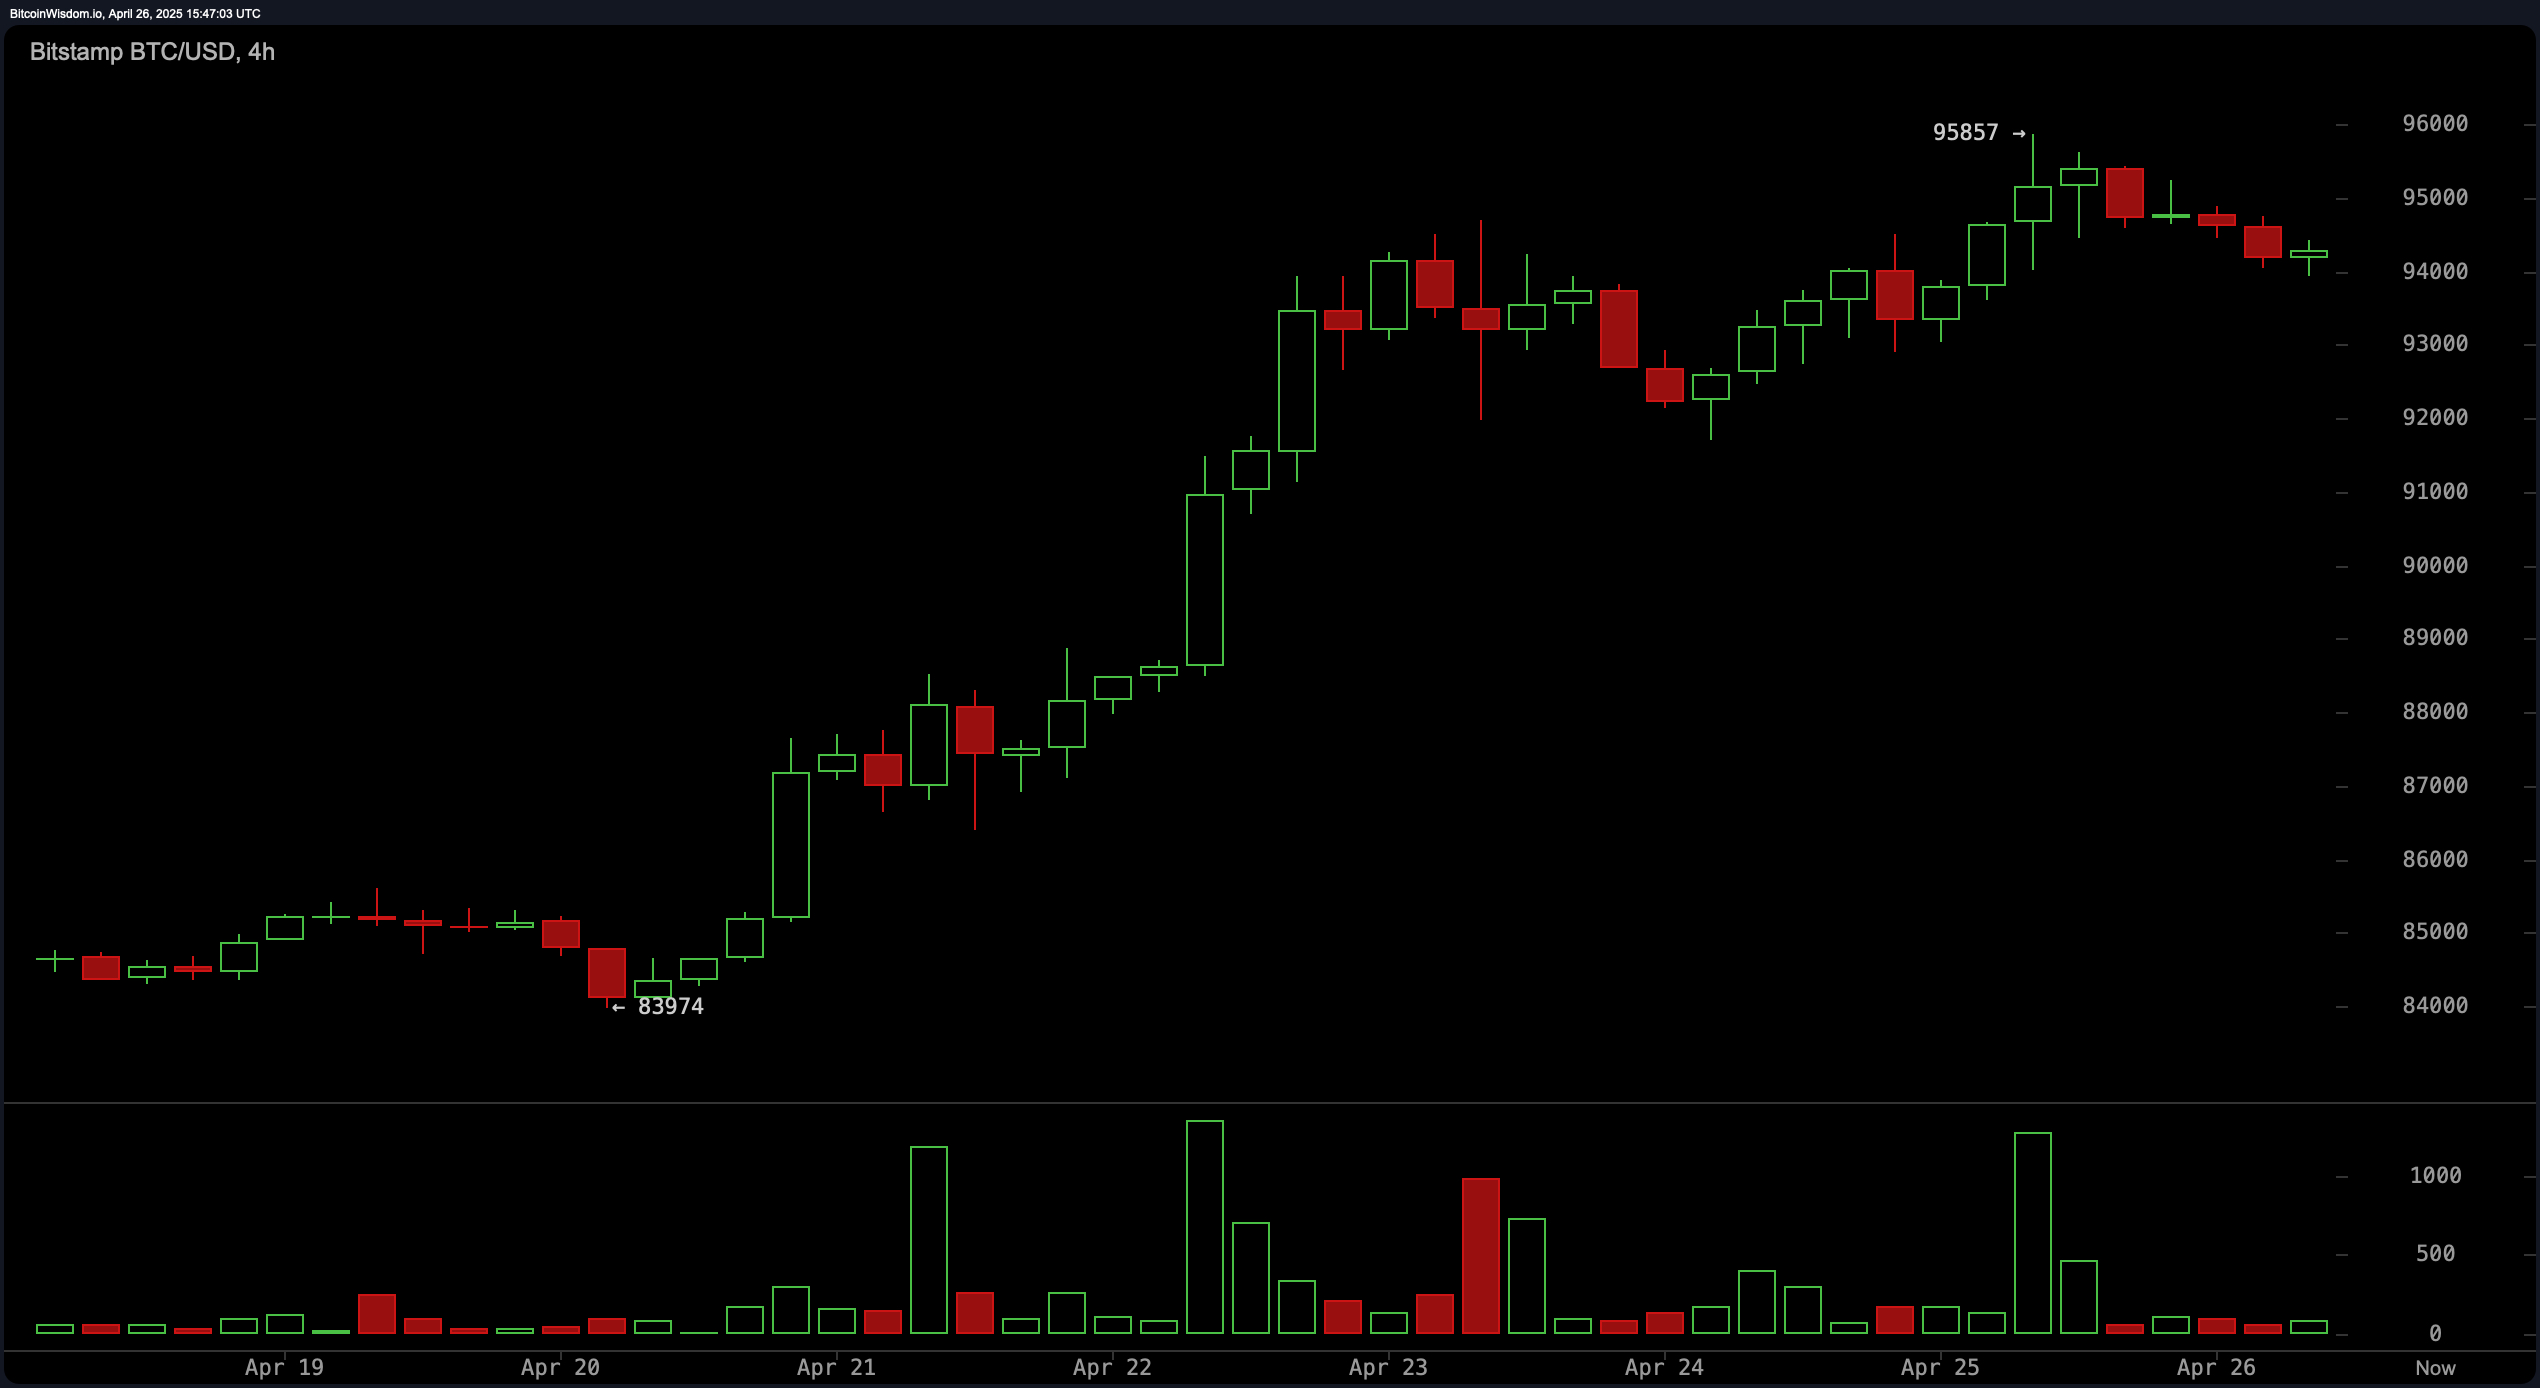
BTC/USD 4-hour chart via Bitstamp on April 26, 2025.
Zooming into the 1-hour chart, bitcoin is caught in a sideways consolidation pattern between $94,000 and $95,000. Volume has contracted notably, which typically precedes a decisive move either upward or downward. The momentum indicator printed a reading of 10,249 with a sell signal, aligning with potential bearish divergence signs—higher price highs not mirrored by higher momentum. Traders are advised to watch the $93,800 support for possible short setups or the $95,300 level for a scalp opportunity should a surge in buying pressure materialize. Short-term weakness would likely manifest quickly if support fails to hold in the coming sessions.
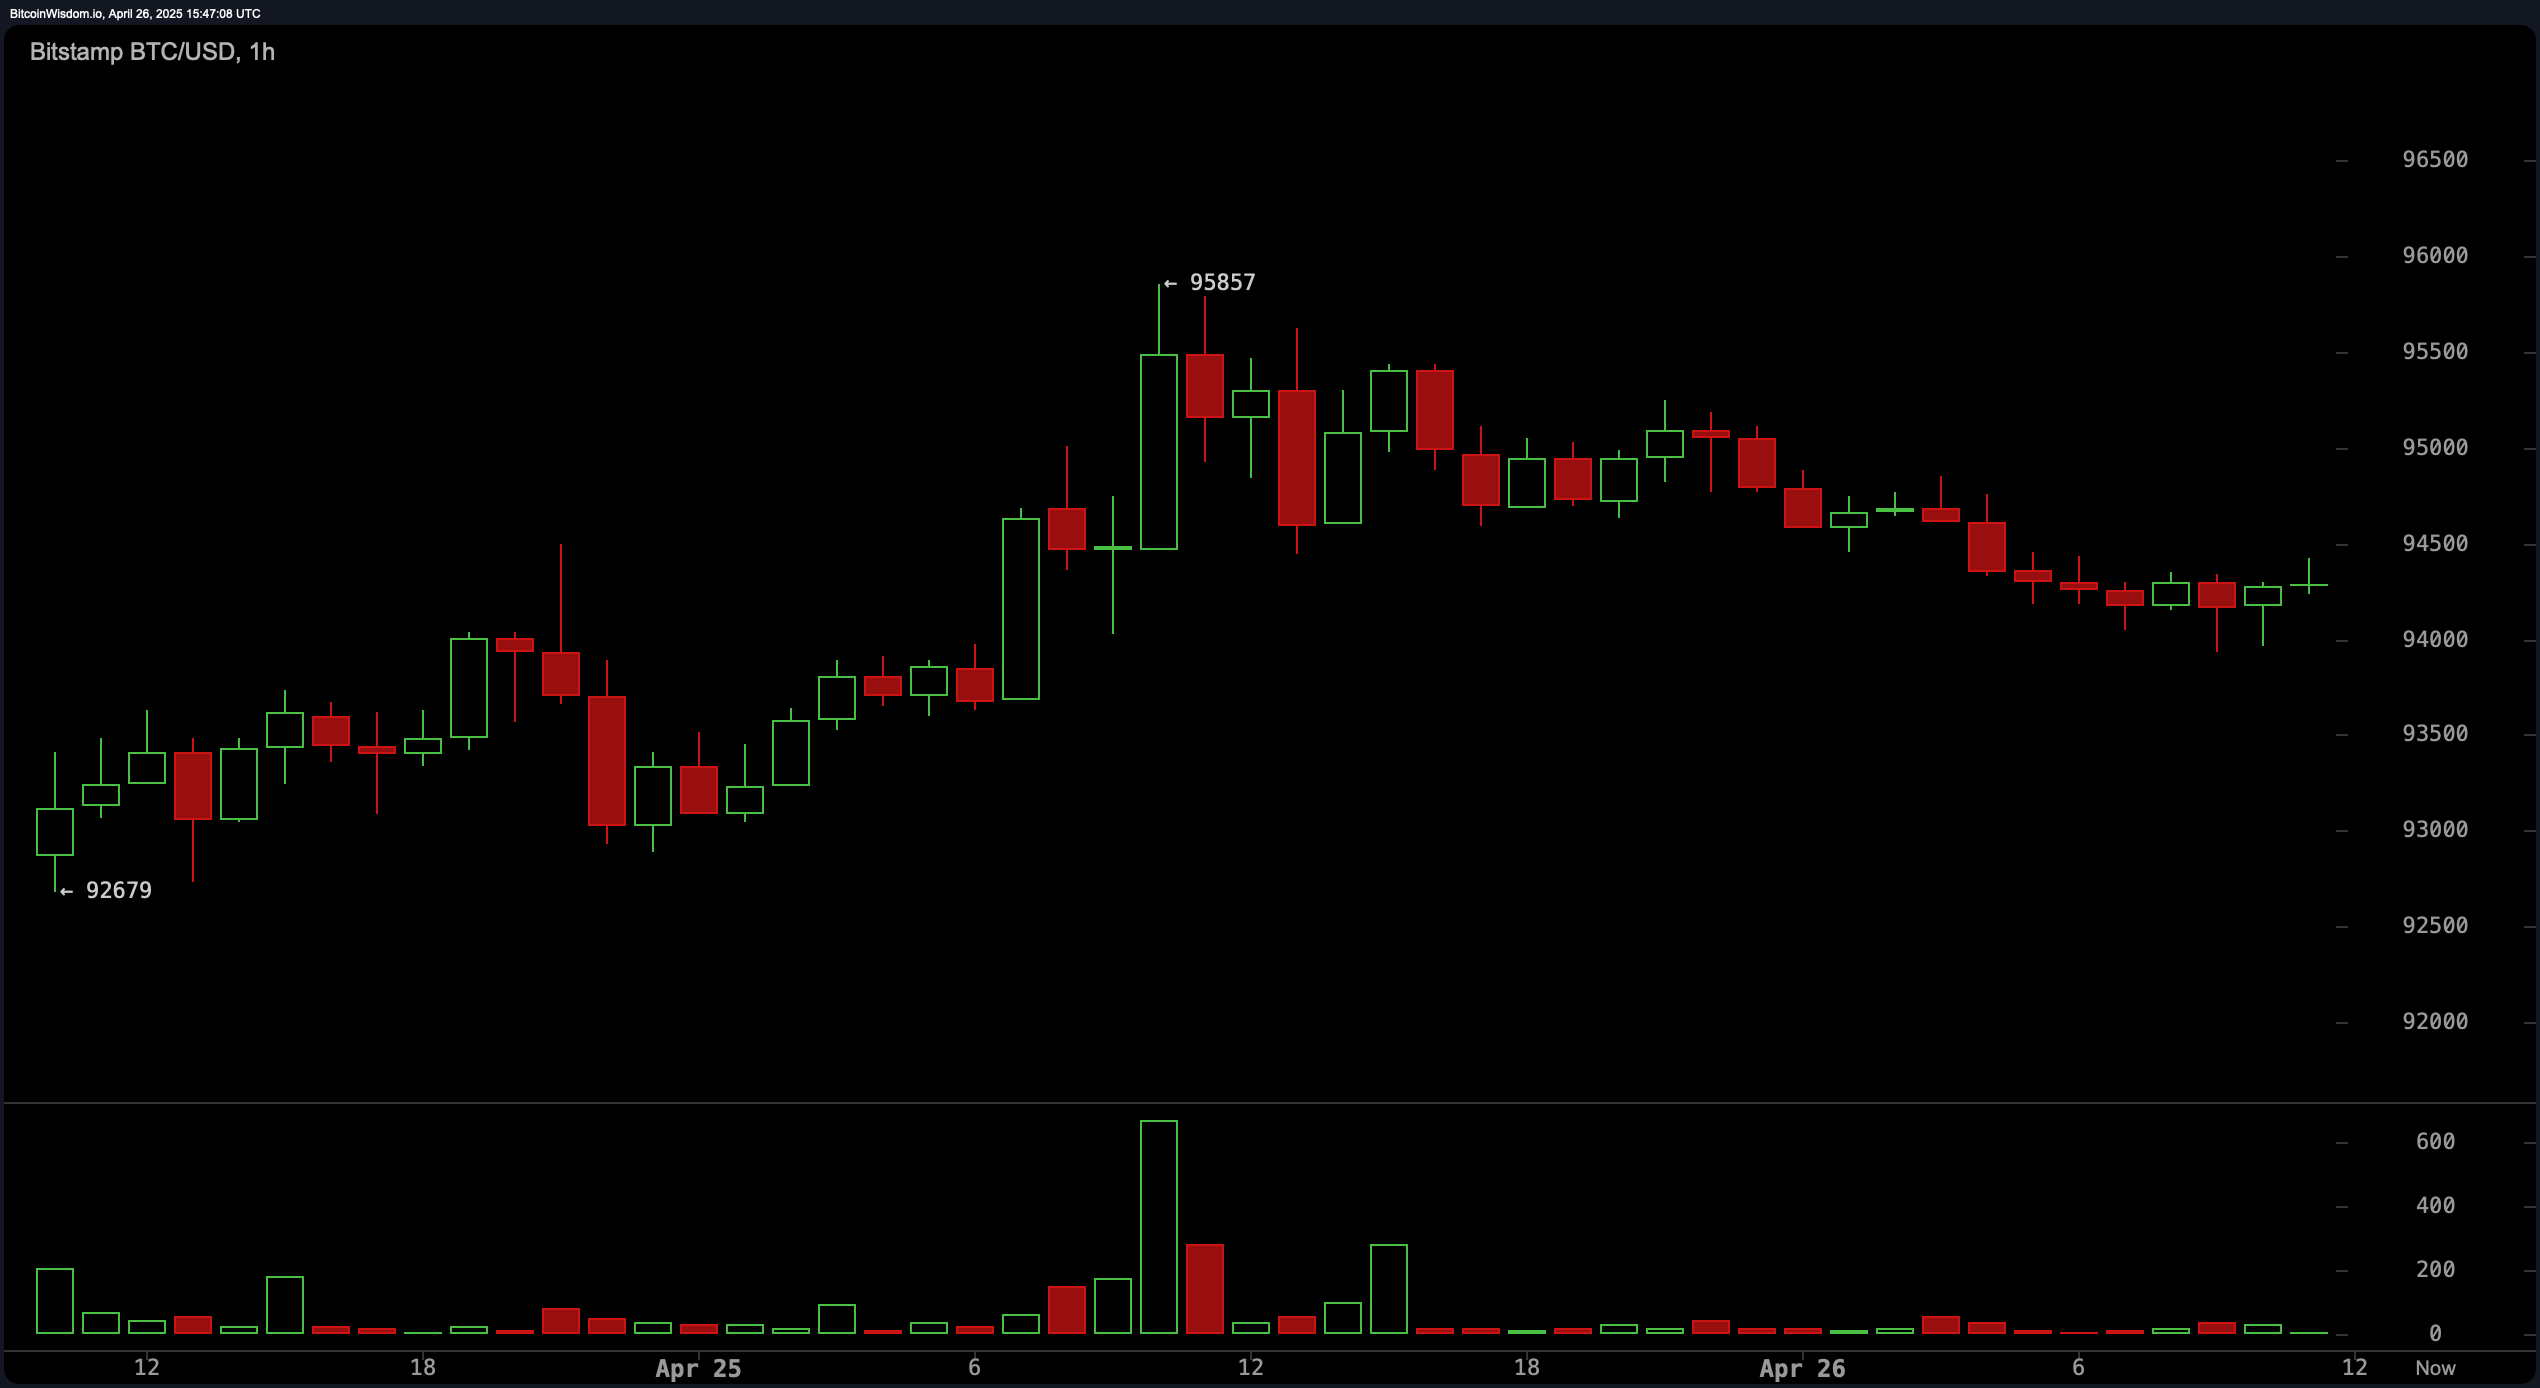
BTC/USD 1-hour chart via Bitstamp on April 26, 2025.
Analyzing oscillators and moving averages across all timeframes offers a blended but largely optimistic outlook. The MACD level (moving average convergence divergence) has turned positive with a buy signal at 2,659, while nearly every exponential moving average (EMA) and simple moving average (SMA) from the 10-period to the 200-period also broadcasts buy signals. This underlines that while short-term pressures exist, the broader market structure favors a continuation of the prevailing uptrend. Traders positioning for longer horizons may find pullbacks into the $90,000 to $92,000 support zone particularly attractive entries.
Overall, bitcoin remains bullish on higher timeframes but appears vulnerable to short-term consolidation or minor retracement. Investors and traders should remain vigilant for a confirmed breakout above $95,800 to affirm continuation or, alternatively, brace for a pullback toward the $90,000 psychological support should $93,500 give way. Market dynamics indicate that patience and disciplined risk management will be critical in the days ahead.
Bull Verdict:
Bitcoin’s technical structure across daily and 4-hour charts remains firmly bullish, supported by consistent buy signals from all major moving averages and a positive MACD level. If price stabilizes above $93,500 and breaks cleanly through the $95,800 resistance, bitcoin could continue its climb toward the $97,000 to $98,000 zone in the near term.
Bear Verdict:
Despite the overall bullish backdrop, several oscillators are flashing sell signals, and short-term charts reveal signs of exhaustion and bearish divergence. A failure to hold the $93,500 support could trigger a sharper pullback toward the $90,000–$92,000 region, signaling a deeper correction before any potential continuation higher.